What Was I thinking?
I was a long-time cannabis patient when I started writing about cannabinoids and terpenes for an audience on Medium. I had thought it was a ‘no brainer’ to recommend that people use cannabis lab tests to determine what strains and products worked best for them. That was until I tumbled data-first into a world cloaked with science but filled with fraud. Over the next three years, I spent countless hours and too much money chasing an understanding of what was going on – and I’ve compiled everything, the best I could – into this one, monster article.
How Does 46% THC Flower Happen
In the midst of investigating cannabis lab issues in Oregon, I saw some flower advertised as 44% THC that was selling at $5 a gram. I’m sure you know what happened next — I had to buy it.

The fact that flower with such a high percentage is selling for $5 a gram tells me that there’s something wrong with the lab result on it. It also means that the retailer didn’t carefully examine the cannabis or its paperwork on intake, or doesn’t have procedures to do so.
43% is unreal. High testing, high quality kief is around 51%.
And the fact it’s priced so low when THC is supposedly so prized? Says a lot!
Bonus — it’s not even a picture of the cannabis itself — that’s Leafly’s ‘default weed’ picture.
Obviously, when I saw this yesterday, I knew I had to get this flower. Especially when I called the shop and the budtender ‘didn’t know’ who tested it.
I had to know. I had to know for myself who tested it and what I thought of it.
The Label and Package
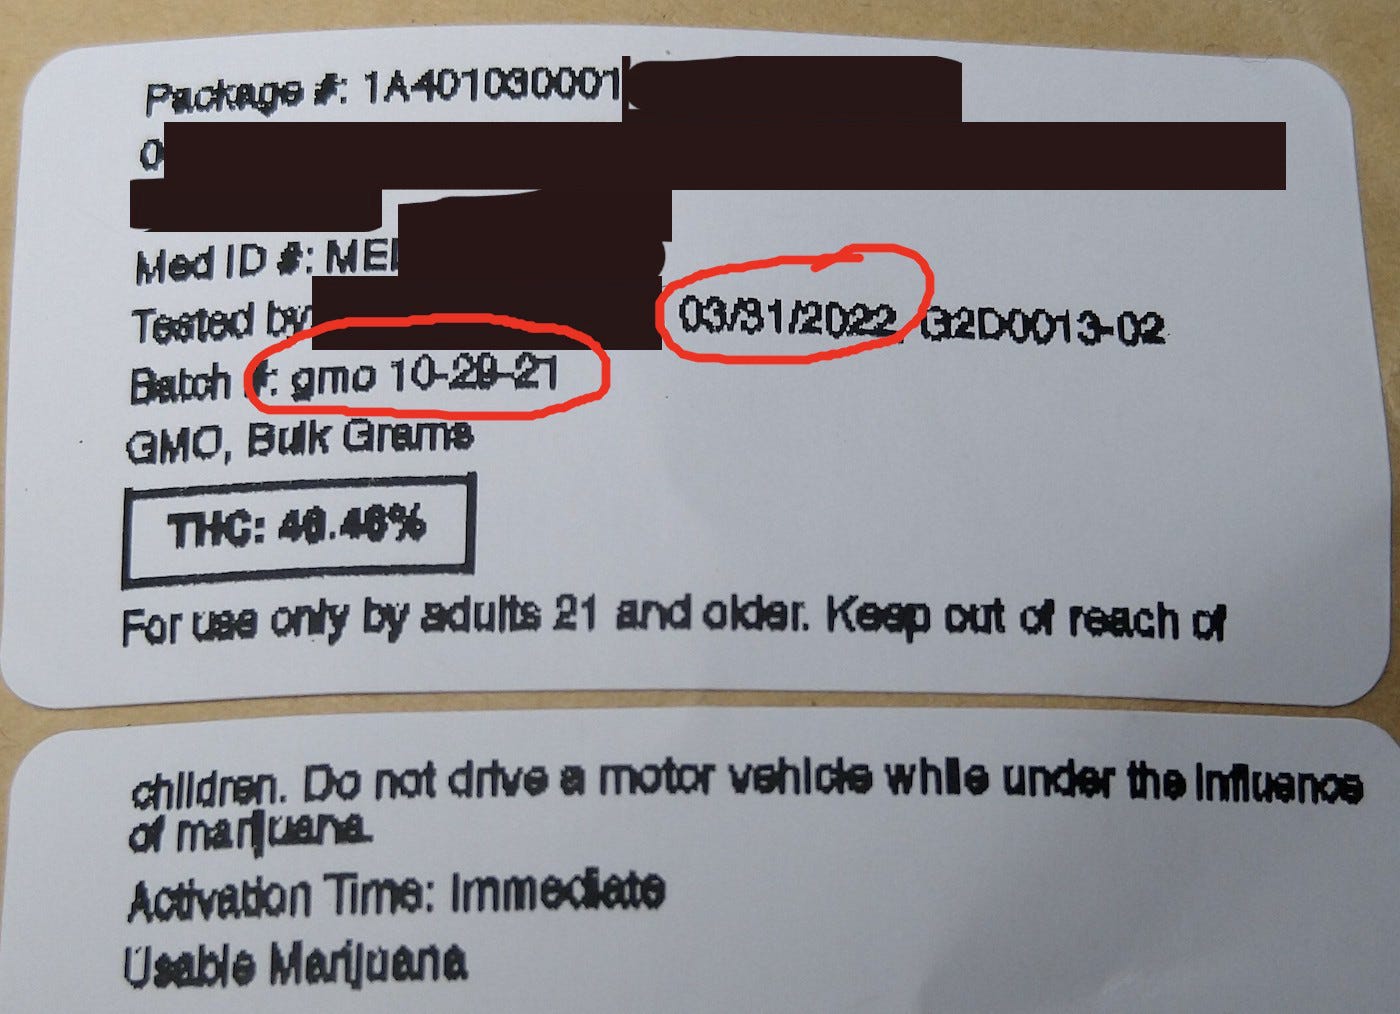
The label brings more questions than it answers.
What regulatory system wouldn’t trigger an audit on a result like this?
Why is this in Leafly as 43%? It’s listed in METRC as 46%!?
There’s no Harvest Date listed which the rule stipulates there should be, so the dispensary that doesn’t check percentages too well also doesn’t check their labeling. Has this retailer never had their labels checked?
We can derive from the Batch Number that the Harvest Date is 10/29/2021.
But the cannabis wasn’t tested until 3/31/2022.
What kind of a grower would grow a cannabis that they thought would break 30% , but not get it tested until five months later? These growers would have been straining everything to get this result: why wait so long to test it that it might sacrifice some of that potency?
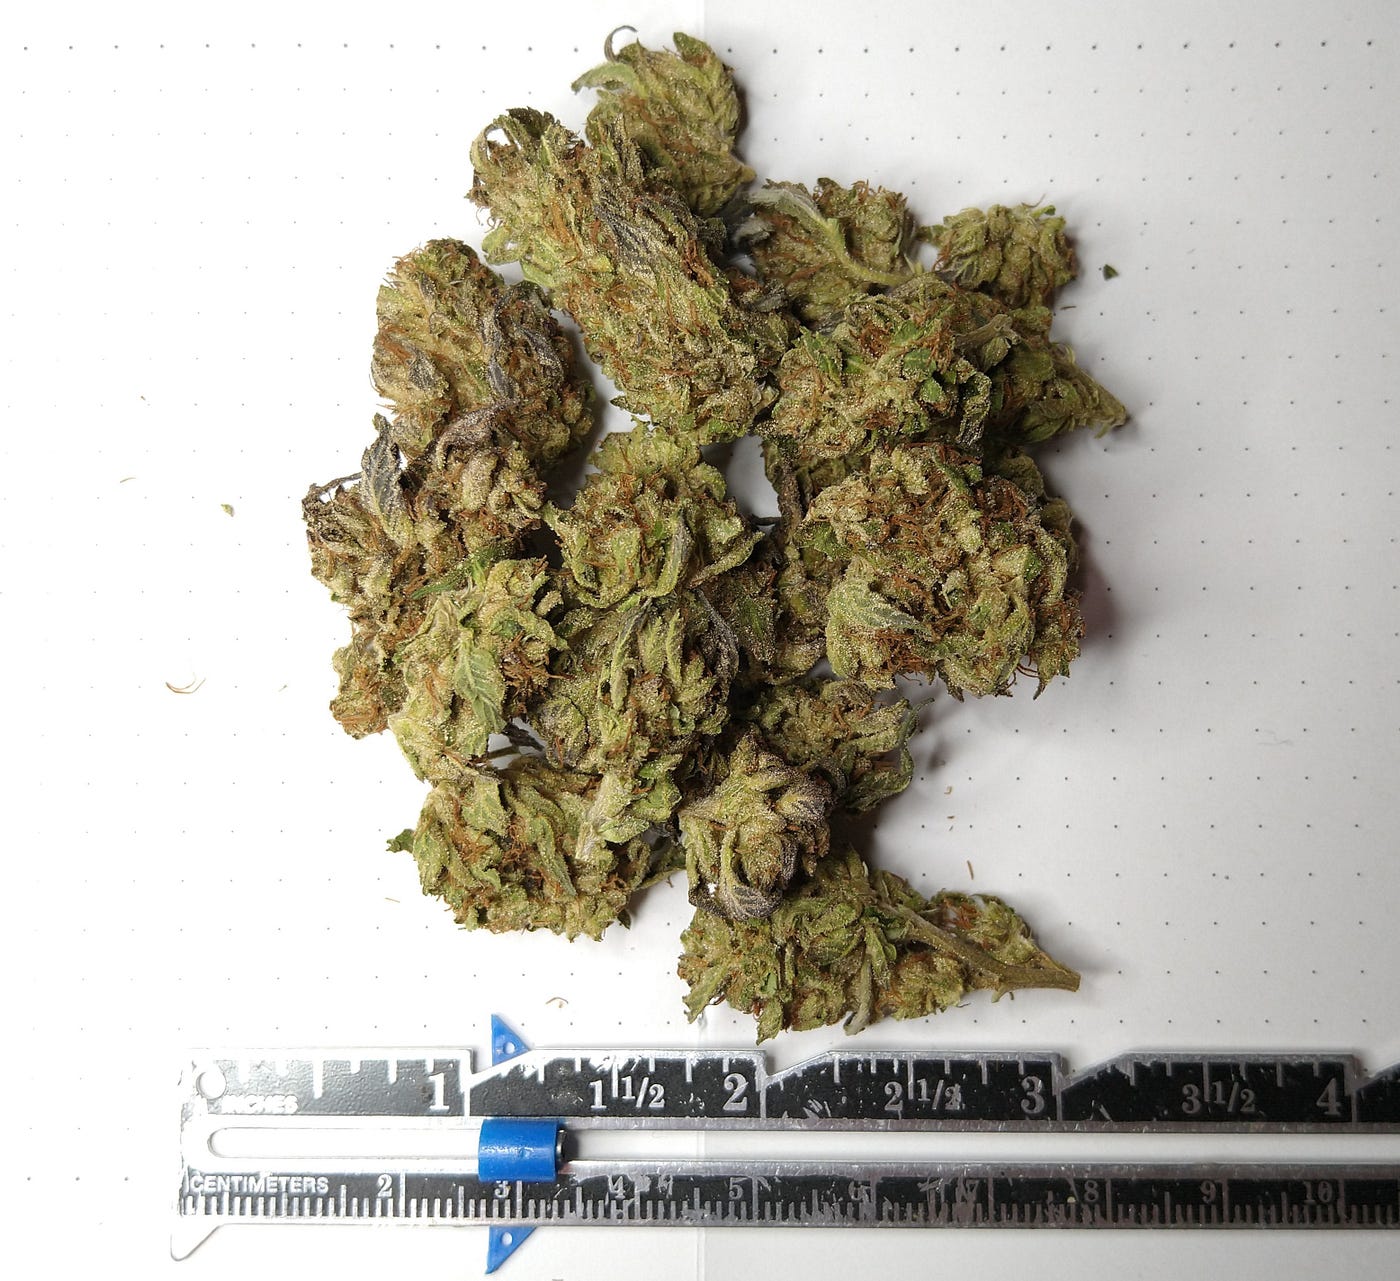
What Does This “46% Weed” Look Like?
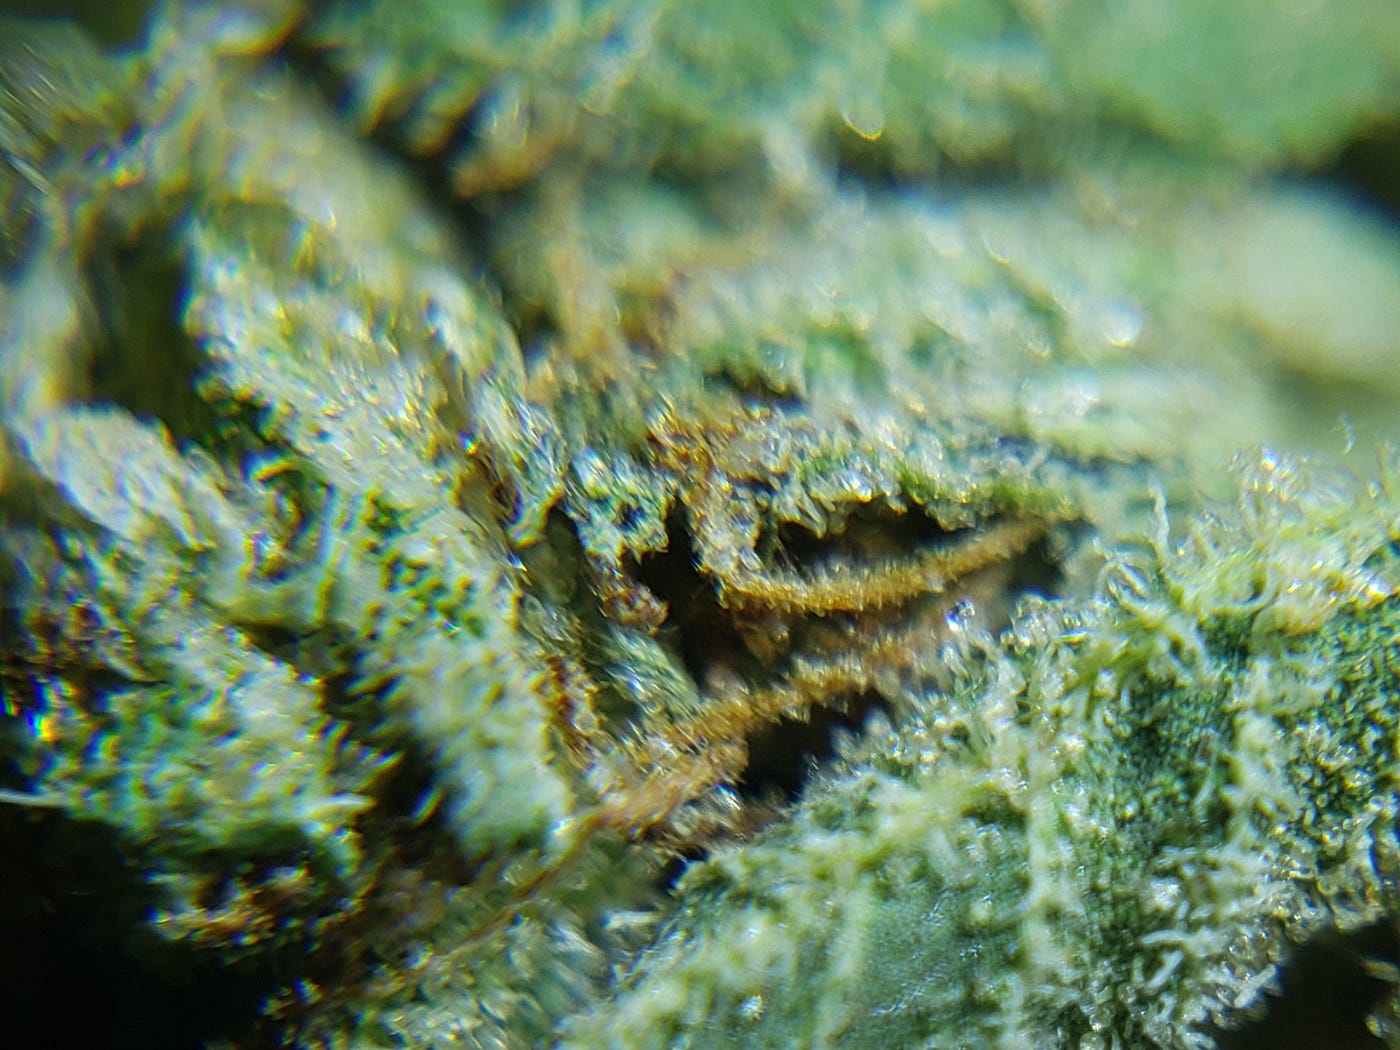
Here it is with some magnification to try and find some trichomes. See how many fully formed trichomes you can find!
As you can see to call this bud visually underwhelming is an understatement.
It’s a GMO, but its nose is off, with far more garlic than any skunk or chem at all. The flavor of the vapor at lower temperatures is very garlicky, and at higher temperatures it takes on more green tones. Overall the terpenes and flavor are exhausted relatively quickly.
Effect-wise, it’s an overall underwhelming experience if you are looking for 46%, but if you are satisfied with a nice body high that probably tests around 20%, this isn’t too bad.
The Verdict?
There’s literally no reason to need to lie about this cannabis.
The fact they lied about it makes it the worst. I worry with every pull that they might have lied about pesticides or mold.
It’s not the greatest, but it didn’t have to be the worst, and somewhere there’s a stoner that would love it.
In other words, it would taste better if it wasn’t made of lies.
Why doesn’t the farmer value their consumer enough not to lie? Surely the farmer knew that 46% isn’t realistic when they got the result back.
Why did the lab director sign off on this result? Who would put their scientific credentials on the line for a result like that?
Why don’t results like this trigger audits at the state level in the seed to sale system, if not real-time: a monthly report could have caught this already.
Why would a dispensary buy this and sell it to their clients?
I wanted answers – and so I dug into how cannabis testing was performed and regulated.
Testing Issues In Oregon: A Brief History
Testing issues have been endemic in Oregon. They were notably present since at least 2015, which was the year, the Oregonian did a massive multi-part story covering shortfalls meant to inform residents of issues within the newly forming recreational cannabis industry. Not only were there issues in pesticides getting through the testing process, but there were discrepancies in edibles results as well. In reaction to this piece, in 2016 Oregon adopted some of the most stringent testing policies in the country. However, in 2017 the Oregonian once again did independent testing and found the system to be lacking. Also, they found that the state was not performing any sort of randomized testing on their own.
The years since have not helped labs or the state resolve these issues. In January of 2019, the Oregon Secretary of State released a document entitled “Oregon’s Framework for Regulating Marijuana Should be Strengthened to Better Mitigate Diversion Risk and Improve Laboratory Testing.” In this scathing audit, 15 recommendations are made, intending to help Oregon make up lost time in their laboratory testing standards. Reading this audit made clear that every portion of the lab and testing process had issues. Paper-bound processes constrain how labs are accredited to run tests. Unaccredited labs can subcontract tests, resulting in overtaxed accredited labs. And sampling methods were (and still are) highly suspect.
One of the shocking deficiencies listed by the report was the lack of a reference lab. A reference lab is a third-party lab that you use to help determine the accuracy of the results of the other labs. Without a reference lab, there’s no means of calibration that the laboratories can use to ensure that their results are correct. It also found that the accreditation body for the labs was inadequately staffed and was too limited in authority to ensure they could operate effectively, in addition to having many of their processes on paper. Regulators are happy to blame their woes on the lack of this lab, but there has been nothing done to address the issue since the 2019 audit.
The audit also recommends that tracking be added to METRC, the seed-to-sale software used in Oregon, to allow tracking of when testing is subcontracted. Currently, in addition to ‘lab shopping’ by producers, where they will take their product from lab to lab until they get the THC value they want, there is also a loophole in how the labs themselves subcontract those results. If a lab isn’t accredited to run a particular test, it can subcontract that result to a lab that can — but there is no indication that such a thing happened, nor does METRC have the facility to record such information.
With all of these problems around rudimentary aspects of testing, such as pesticides, heavy metals, and THC — it’s no surprise that there are some nuances in terpene testing as well. If you look at the historical results of a particular strain at a particular farm over time, you can definitely see that testing capabilities have increased, which will bring the overall terpene counts and percentages to appear higher — when it’s our testing capability that has improved.
What 250,000 THC Potency Tests Say About Oregon
I performed a public records request and did an analysis of the 250,000 records for THC tests that the state of Oregon keeps in its Cannabis Tracking System. I quickly received four years of de-identified data in quick time, and I’m grateful to TJ Sheehy and his team who made that happen.
The records request showed not only issues with the labs, but also issues with data collection and governance ( those are always to be expected in data sets like this). But even though it was a perfectly formatted imperfect data file, it still had a lot of relevant information and told quite a story.
In prior stories, I wrote about research into issues with labs in Washington and Nevada by Michael Zoorob. That research gave evidence that there were issues in the labs by examining a frequency analysis and noting the ‘bump’ that occurs around 20% THC, which is a significant number for marketing.
Here are the graphs from the Washington and Nevada Study.
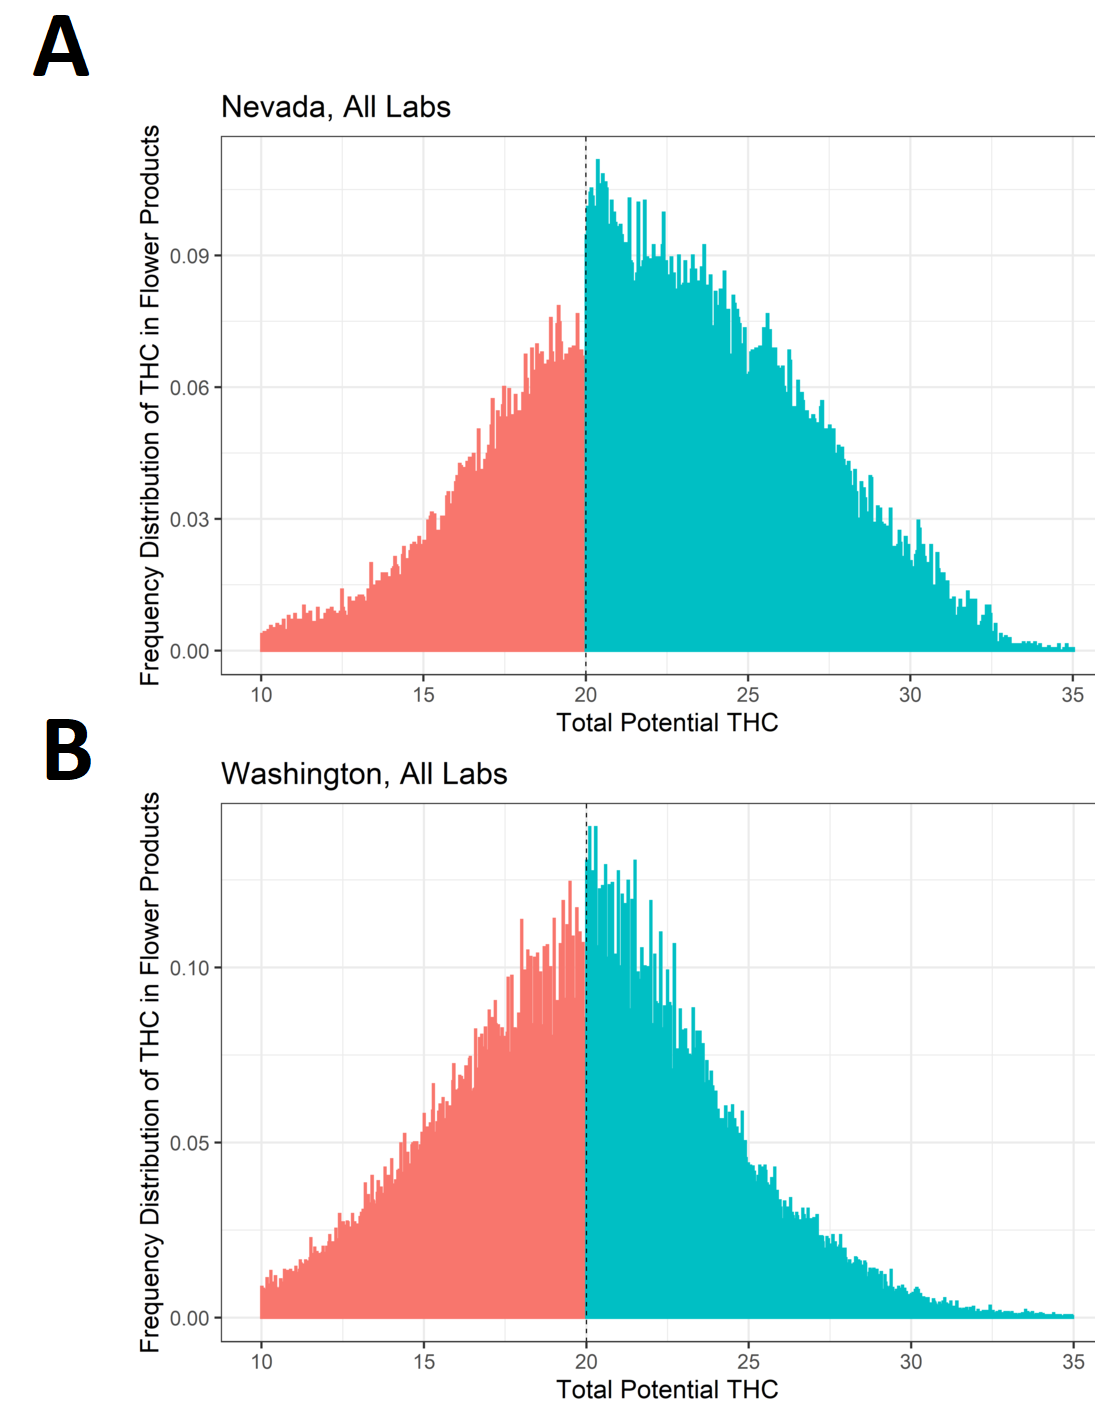
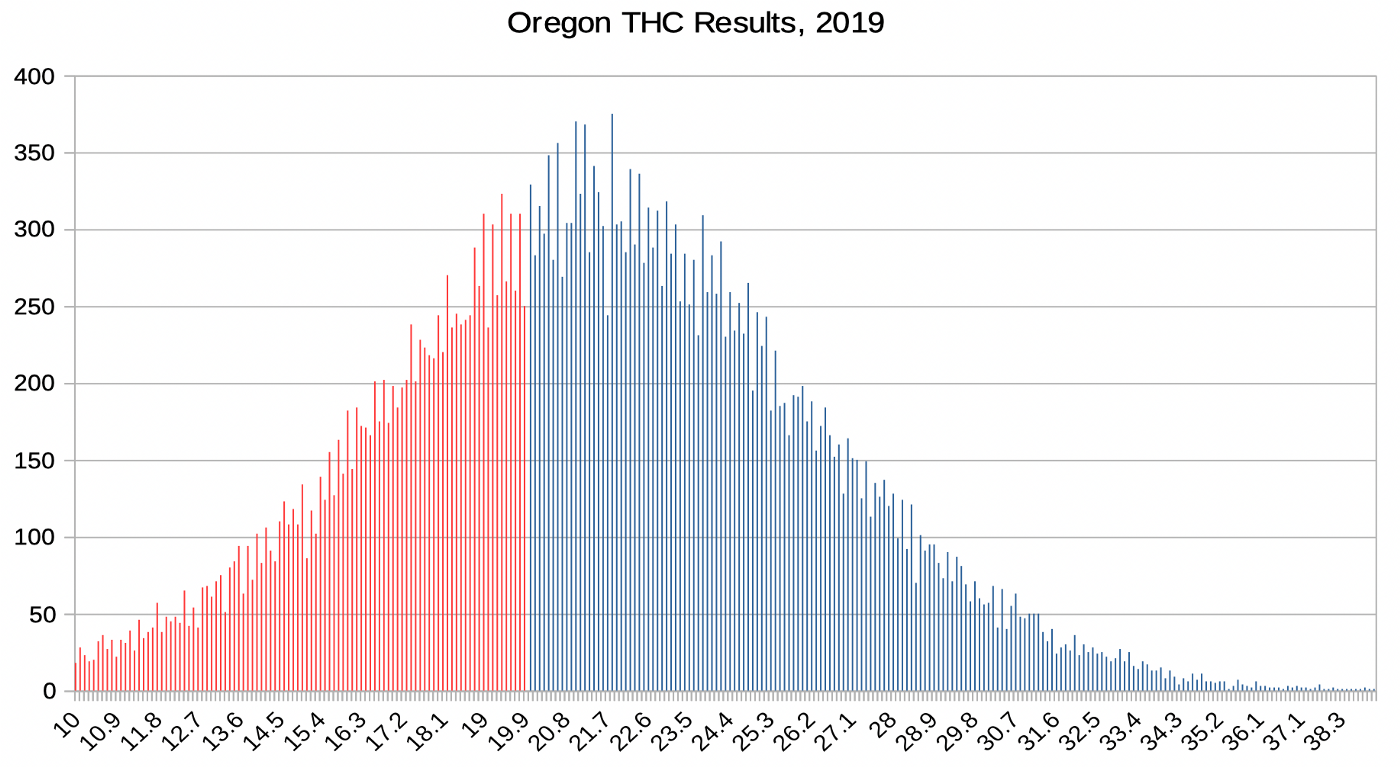
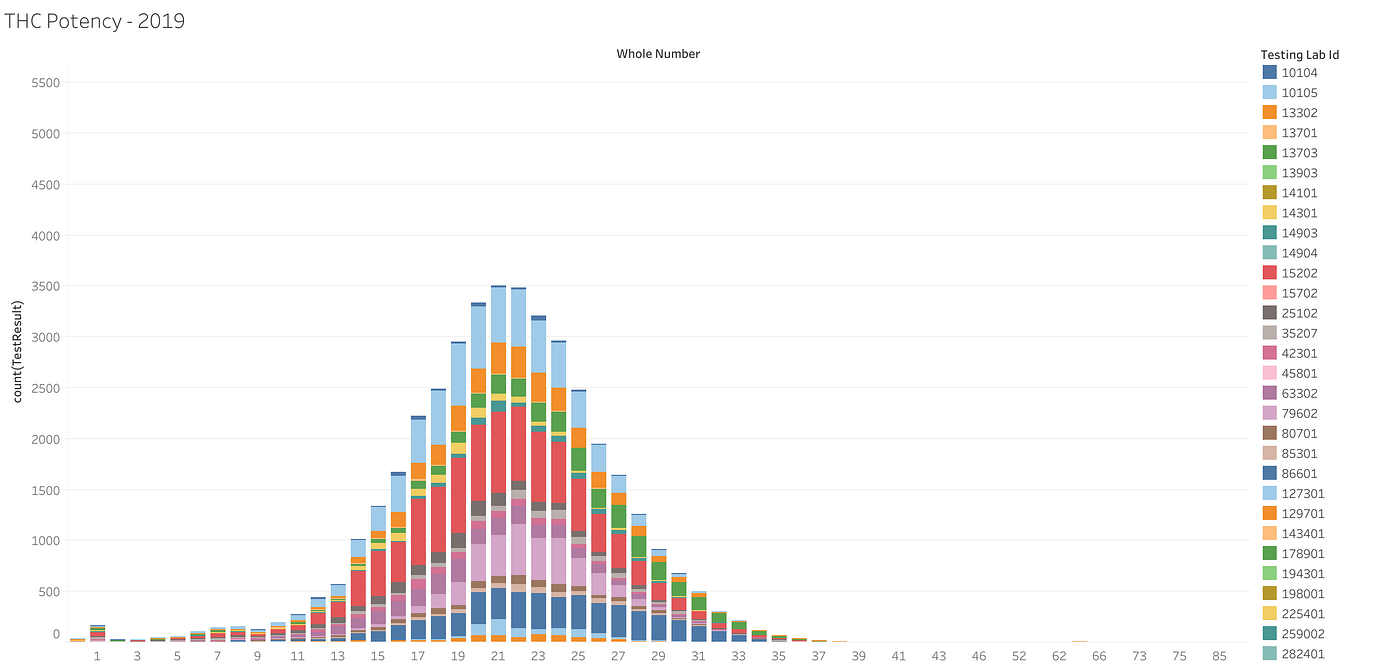
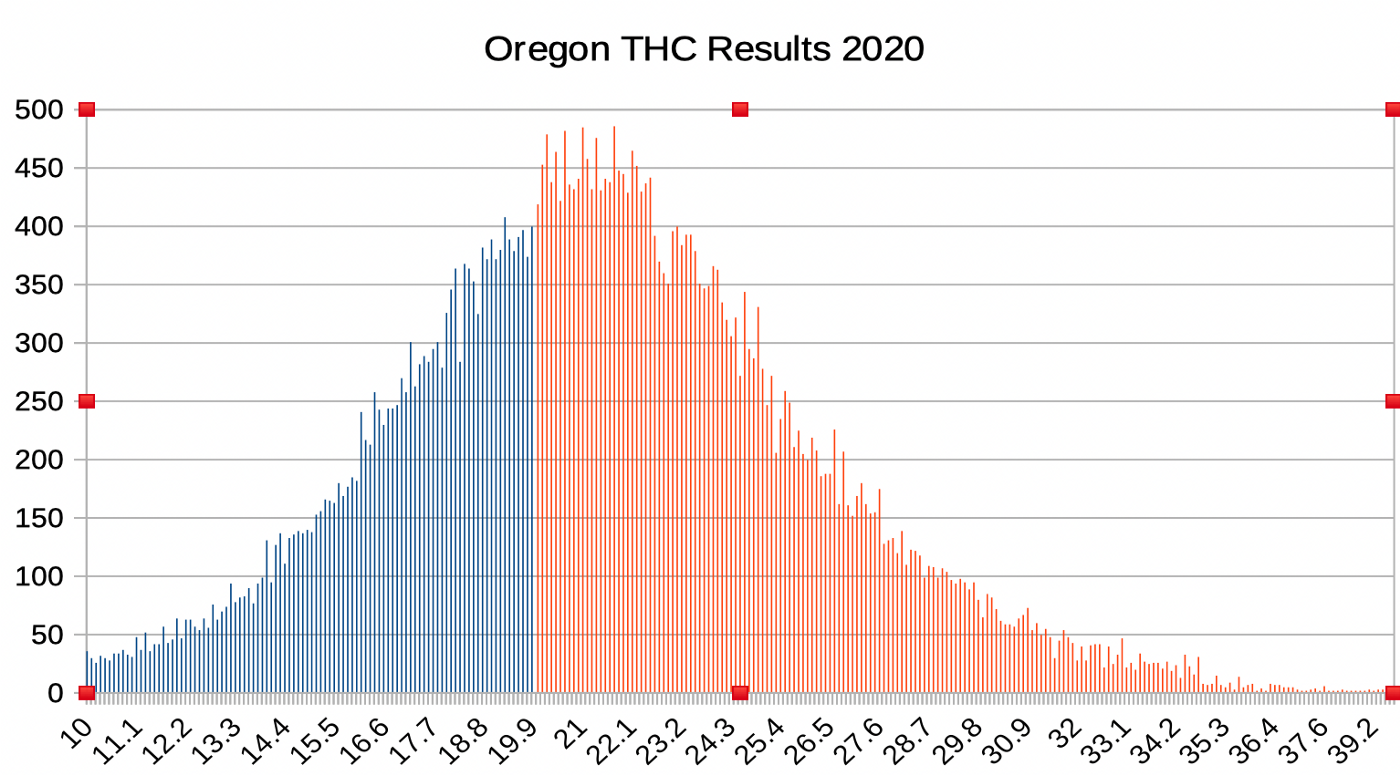
Using my 20 year background in health care data analytics ( I’m even published!), I performed the same graphing on Oregon’s test results. Unlike other areas — I have expertise in this one. In this case, Oregon’s data shows the same deformation of the curve — and it’s gotten WORSE since the audit in 2019. If the state did anything meaningful to address the issue, it’s certain it hasn’t worked.
In 2019, the plateau before 20% THC for flower is very slight.
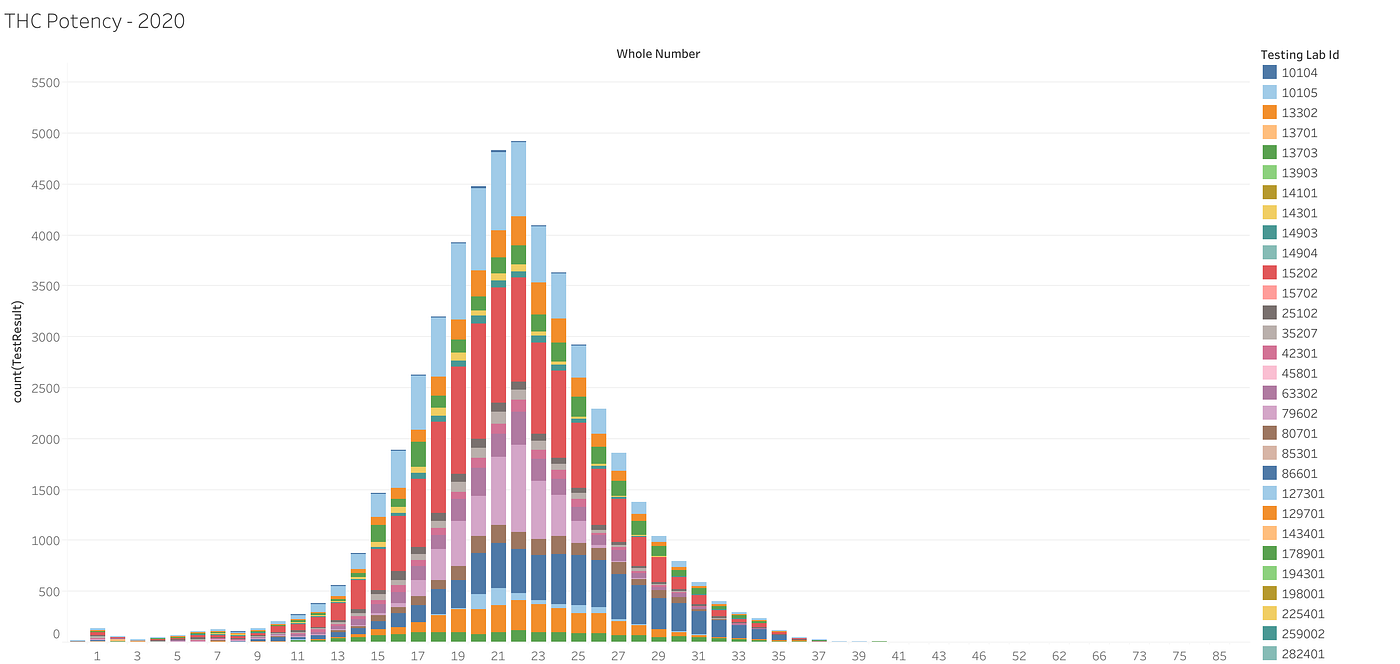
In 2020 you can start to see the break before 20% steepen.
In 2021 it gets out of hand.

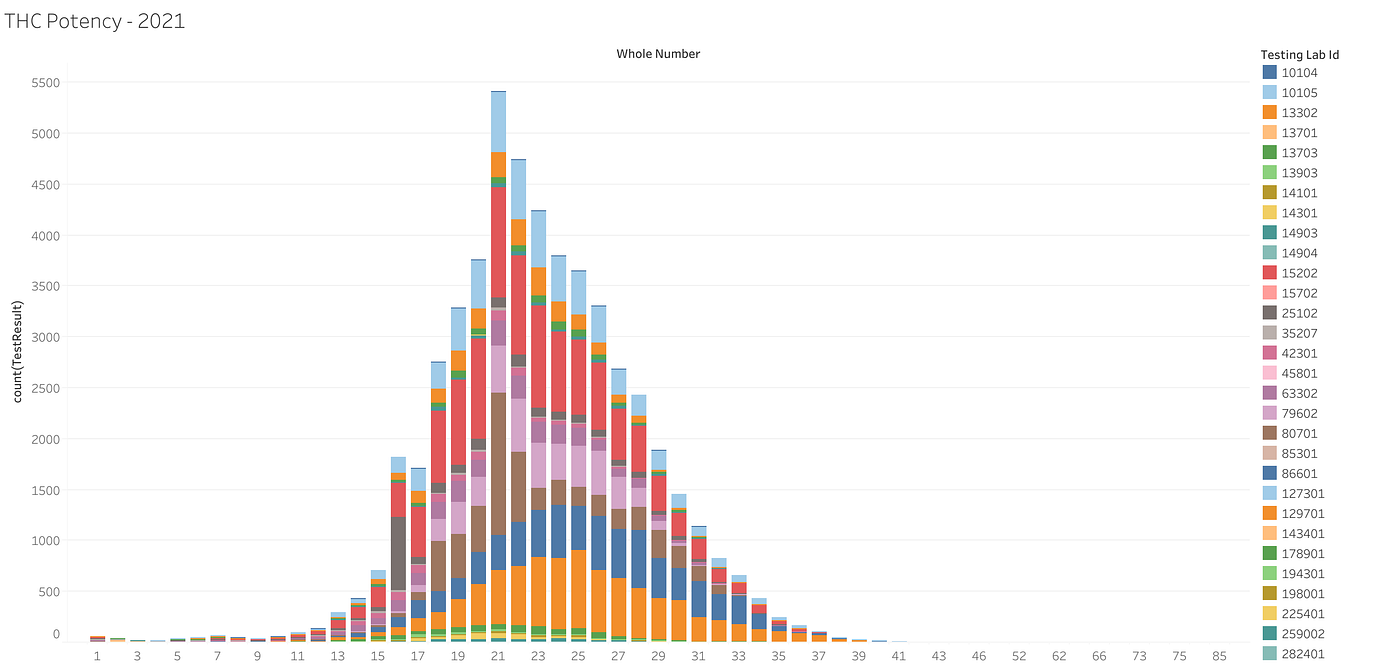
I heard how many thought that perhaps cannabis results wouldn’t conform to a normal curve — and yet — it’s obvious when digging into the data it’s been driven by a few. In fact, one lab in particular had at over 3% of their results over 33%.
Note the curve doesn’t peak at 20, nor should it — the average THC concentration in Oregon is actually at 23.3 for the year of 2021. Which is exactly where this data set peaks. I am working with Michael Zoorob to confirm these findings.
There’s one more graph that is pretty compelling. If I look at just any results that are over a ‘biologically infeasible’ result of above 36%. I’ve color-coded it by laboratory.
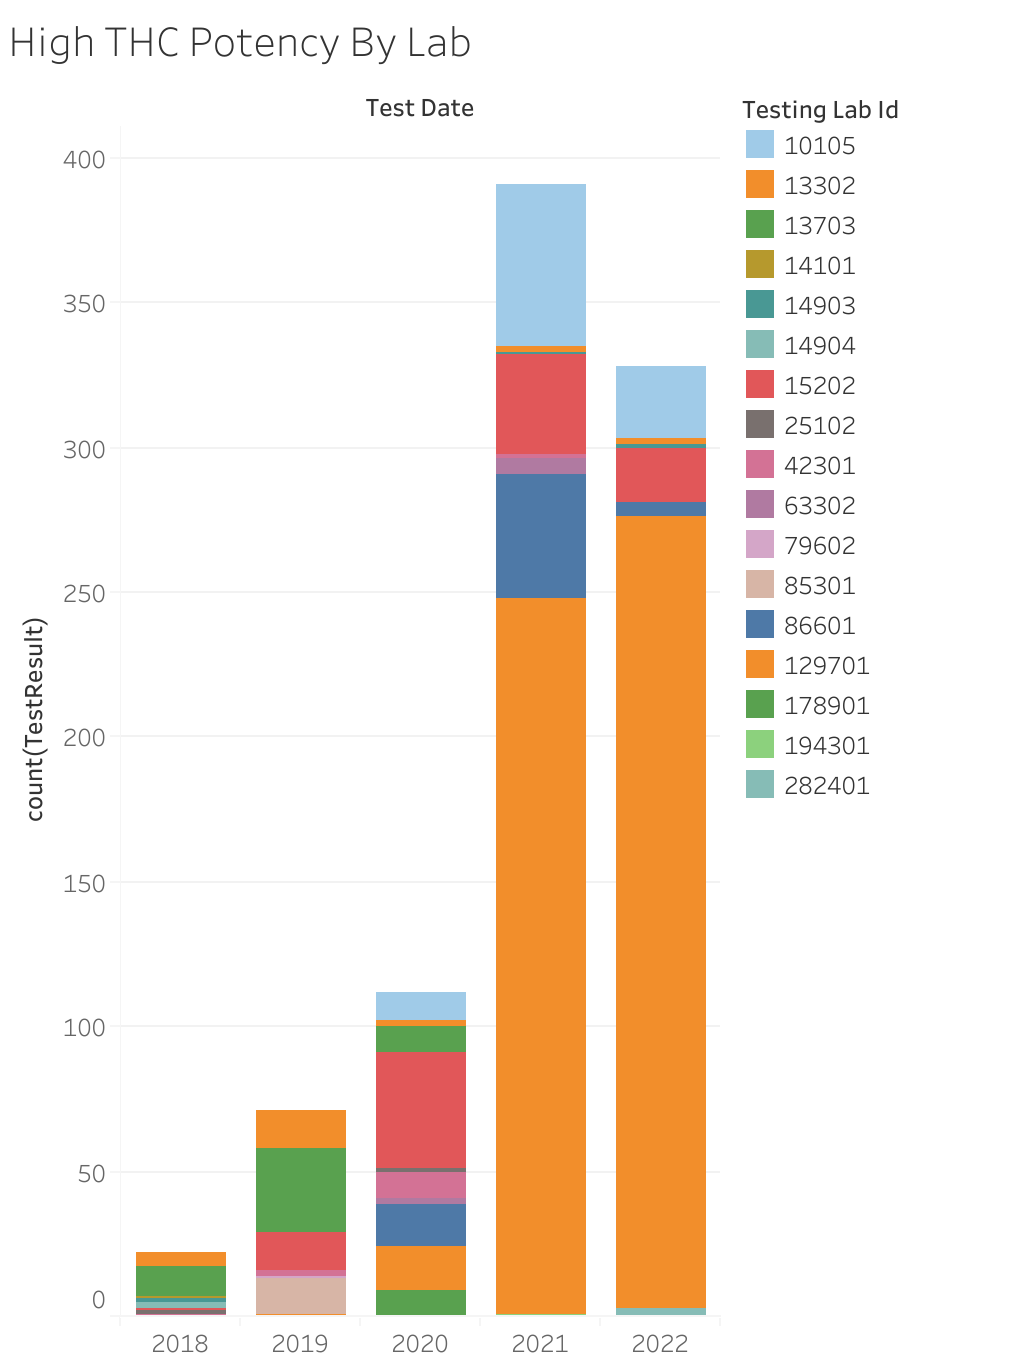
You can see other work I’ve done with the data on a public Tableau I’ve shared here.
Oregon isn’t the only state with issues. I also did an analysis of data I received from a source in Michigan.
Background on the Michigan Data Set
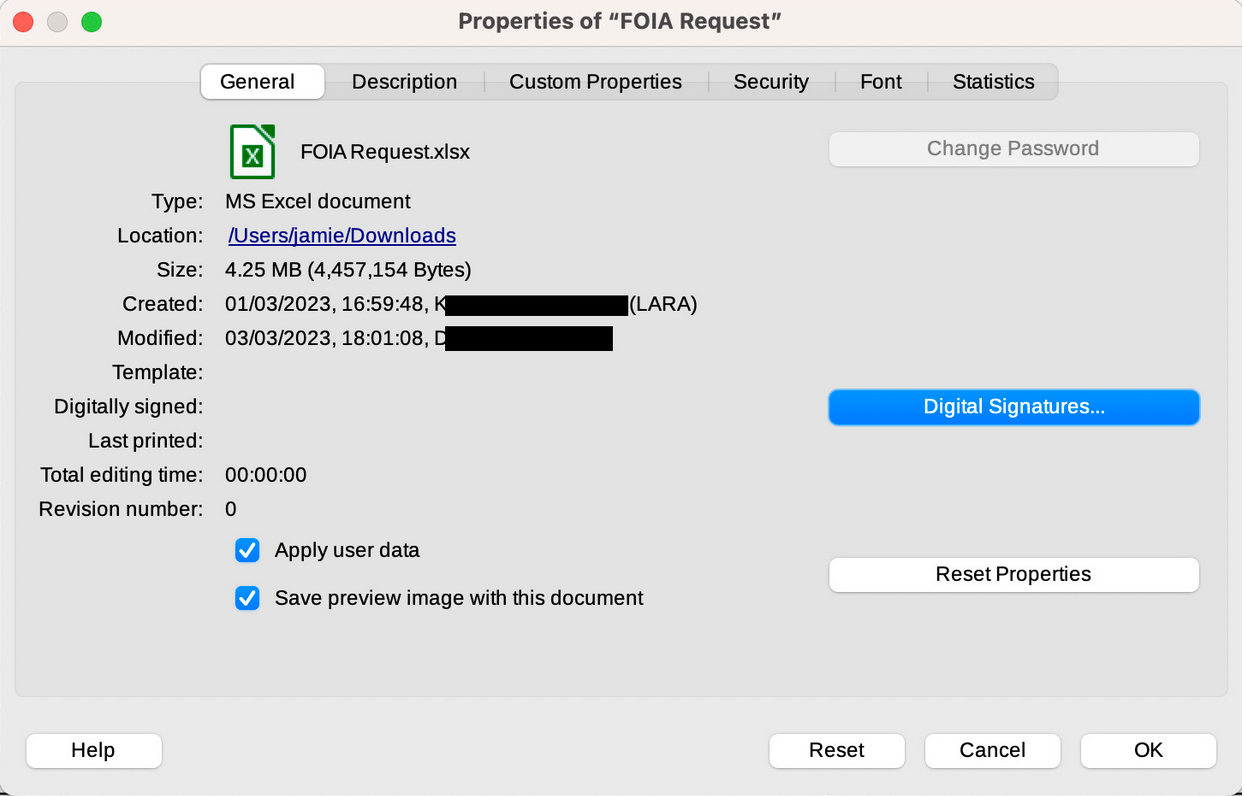
A couple of weeks ago, I had someone reach out to me and send me a data set from Michigan, telling me that it was the result of a FOIA request of METRC data from the state. That was all of the information that I really got from them.
The person who sent me the data did so in confidence, and I don’t want to break that confidence. But — they also have vested interests in laboratories in Michigan. I’ve contacted the state of Michigan in an attempt to validate that this was from them, but according to information in the file, it appears to be legitimate (it names a person who works as analyst for regulatory departments in Michigan). While it shows that someone from a lab edited it, it doesn’t show an actual edit to the file, and shows the time for those edits as 0 — so I believe that change was a filename change.
That said, let’s assume the data is real (it appears to either be real or a very good facsimile of a data set) — how should people, like regulators, researchers, or consumers — even start to analyze this stuff if they get it?
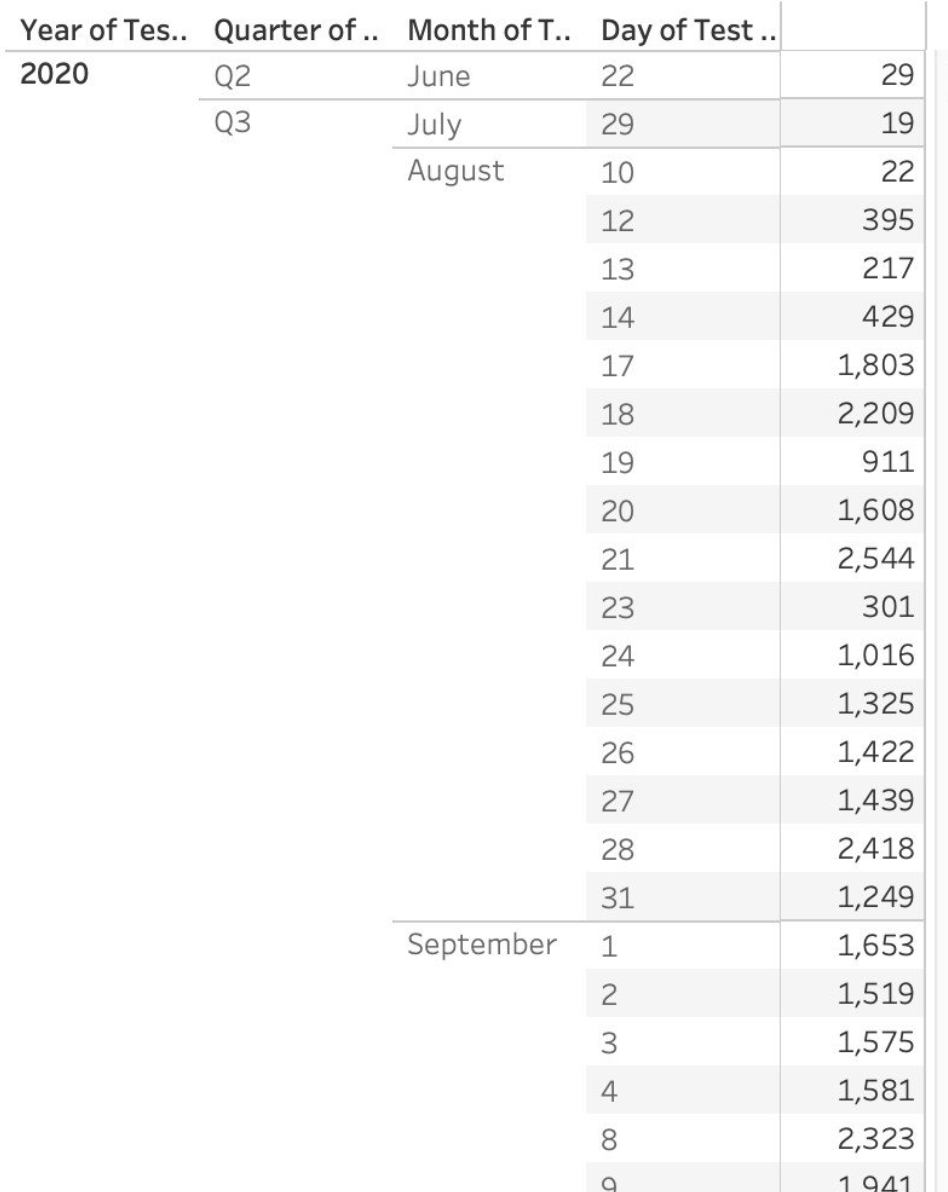
The first thing I like to look at is an overall histogram and just get some generalized statistics, especially since I don’t really have the request to go on. So I looked at the dates, and I noticed that the last tests had a ‘Test Performed Date’ of 1/3/2023 (and it looks like this date is the ‘Test Completion Date’ organized by when test results are finalized through the week). It shows that the first full month the file represents is September of 2020, which means the file appears to contain at least two full years: 2021 and 2022.
Once I got an idea of the timespan that the file represents, I took a look at how the results conform to a normal curve. I do this by Grouping Results into their Whole Number via the ‘Floor’ function in Tableau or the ‘Trunc’ function if I’m on a database level. (this way I’m not rounding upwards and causing more of a disruption towards a higher number). Here’s what Michigan’s results look like.
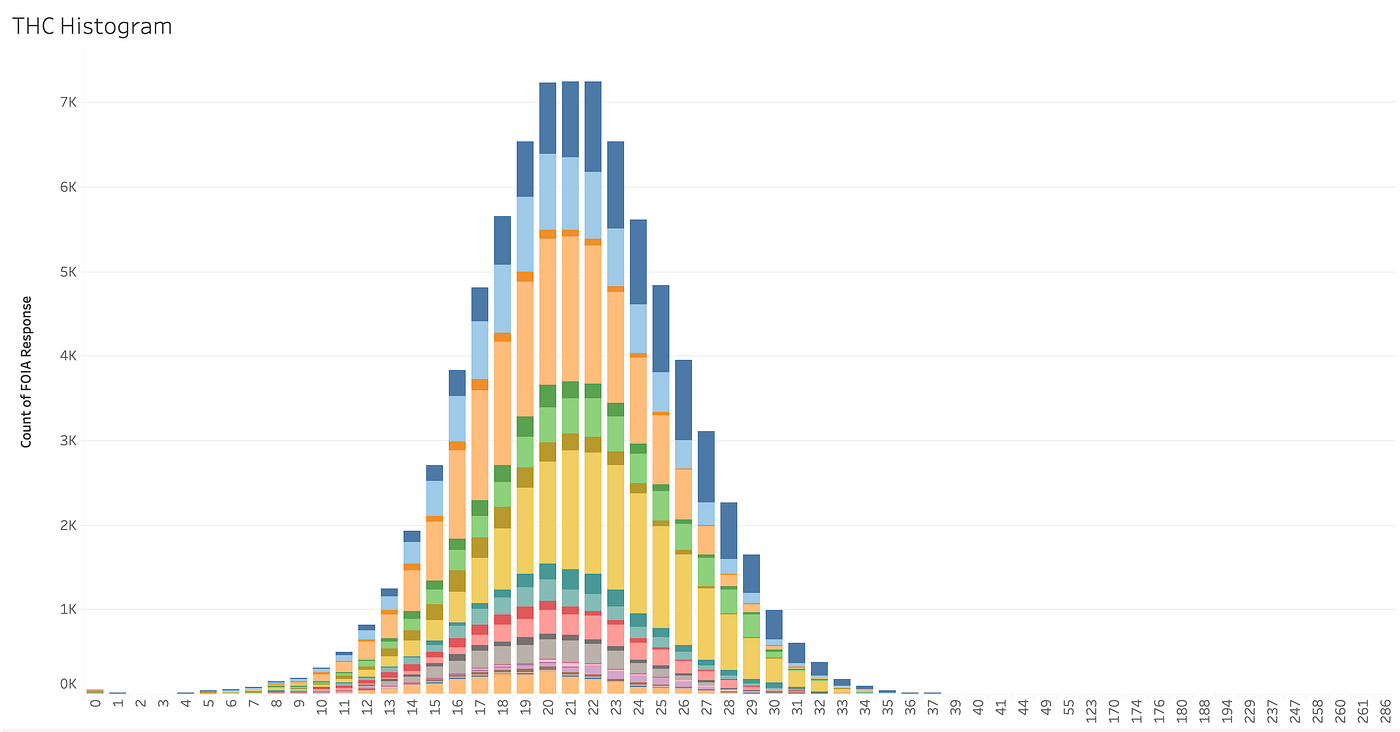
The curve definitely has a wee step up before plateauing, but that could just be a normal curve being a bit normal, and it bears looking into. The best, next step I’ve found is to take a look at whether or not a couple of labs are producing the most high results.
Original Results: High THC Strains by Lab
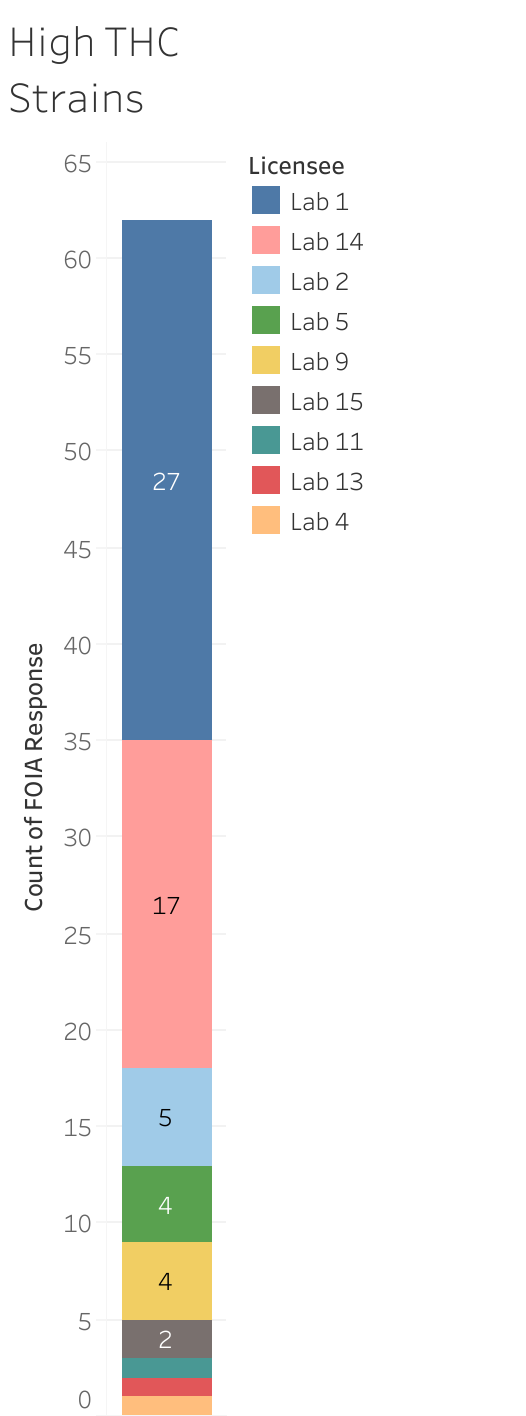
Much like in the Oregon data set, most of the high THC results (results for Flower that are over 35%) are being produced by two labs: Lab 1 with 27 results and Lab 14 with 17 results.
Just because a lab has a high number of high test results doesn’t mean that the entire lab’s data is skewed. This chart looks pretty bad at first, so it’s worth checking to see if a lab that has an overall tendency to produce high results requires digging in a bit more.
Lab 1 Results
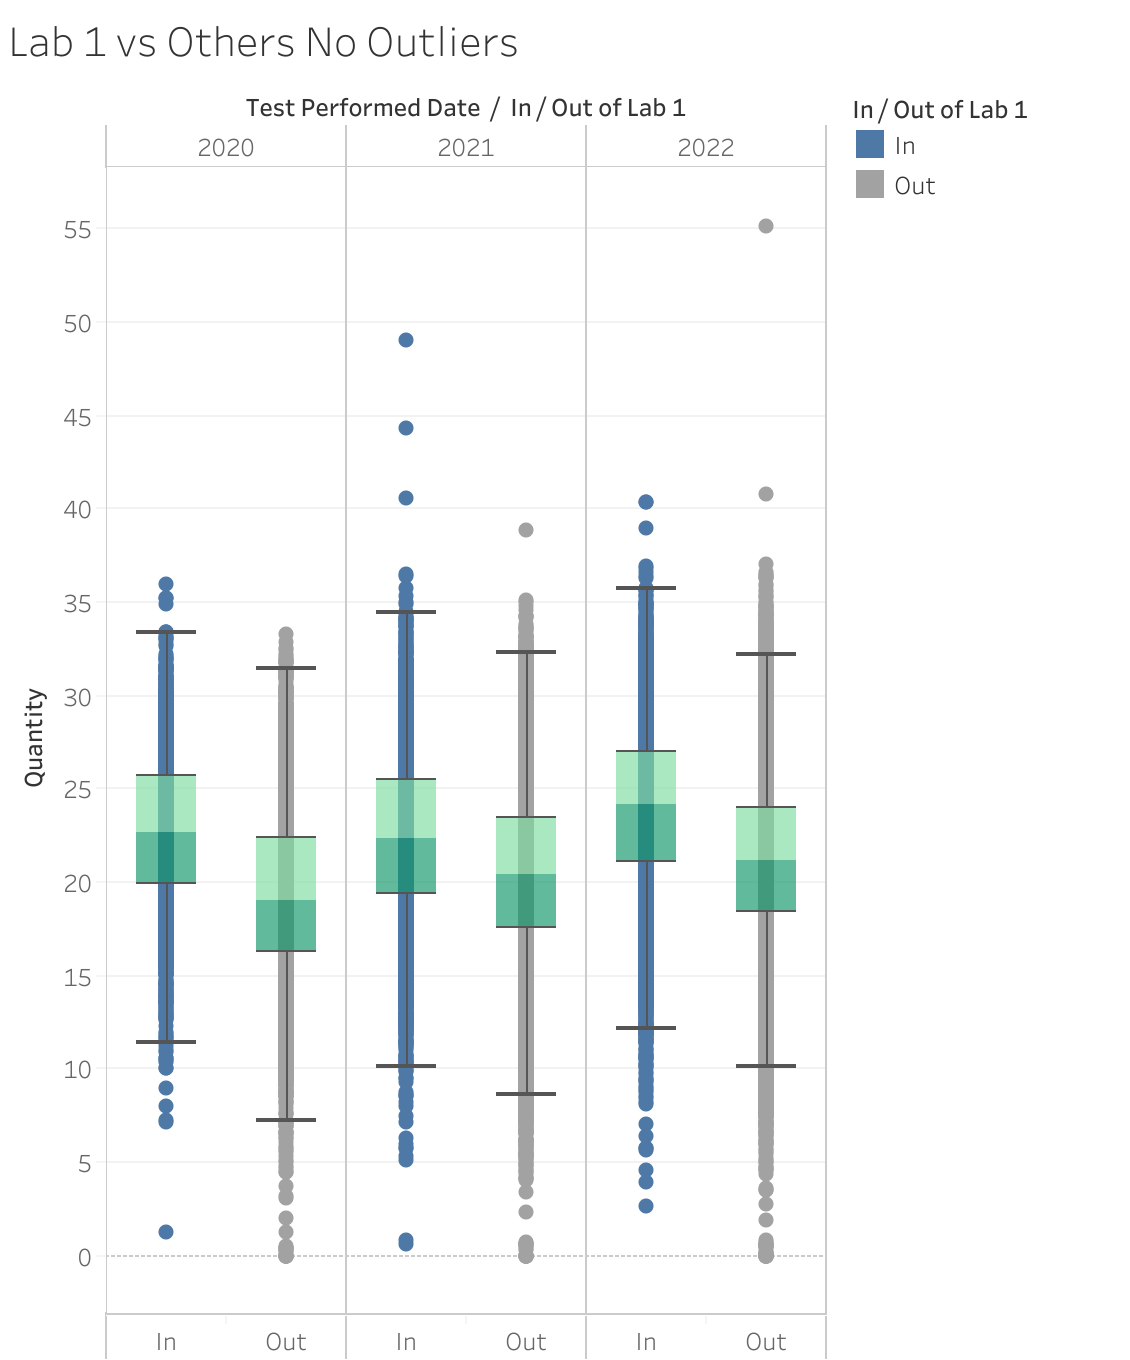
Let’s take a look at Lab 1’s results vs. the results of all of the other labs. I’ll separate the box and whisker plots per year.
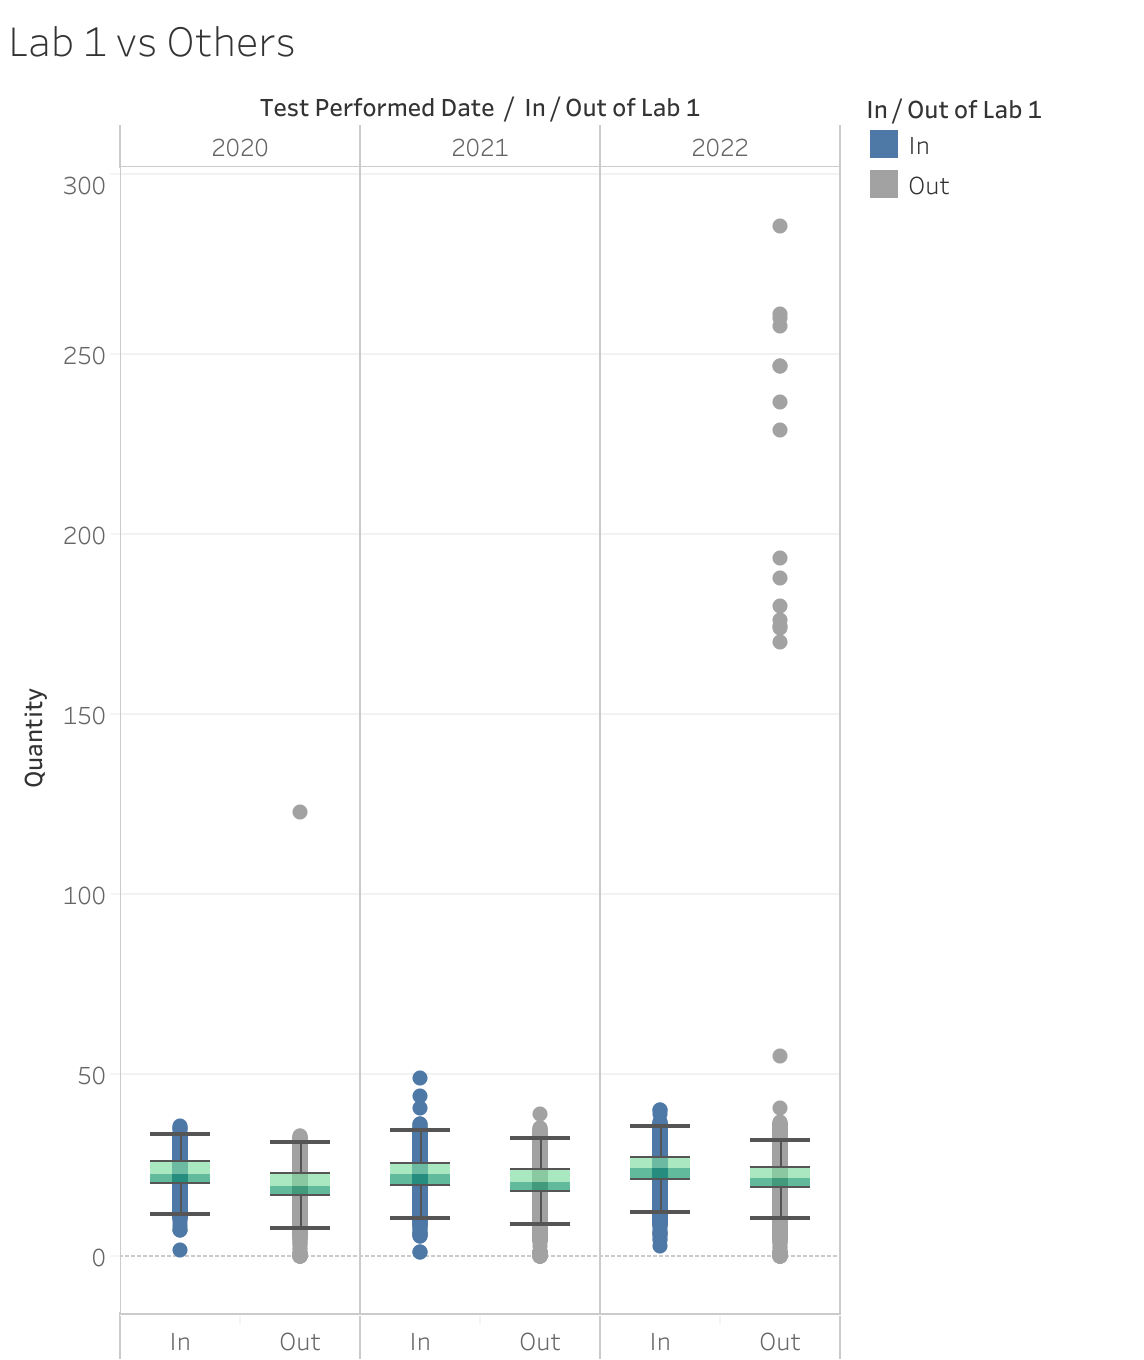
To make this chart possible, I had to eliminate some ‘noise’ at the top end of the data (there are several entries in error showing THC values above 80, etc. and I’ll explain them in a moment.), but once those values are clear, this chart makes it very easy to see that Lab 1 has higher overall THC Percentages than all of the other labs.
Lab 14 Results
Let’s Look at Lab 14 — it will also explain that ‘noise’ we saw above: all of the ‘percentage’ values that were somehow over 100.
Lab 14’s box and whisker vs. the other labs looks like this.
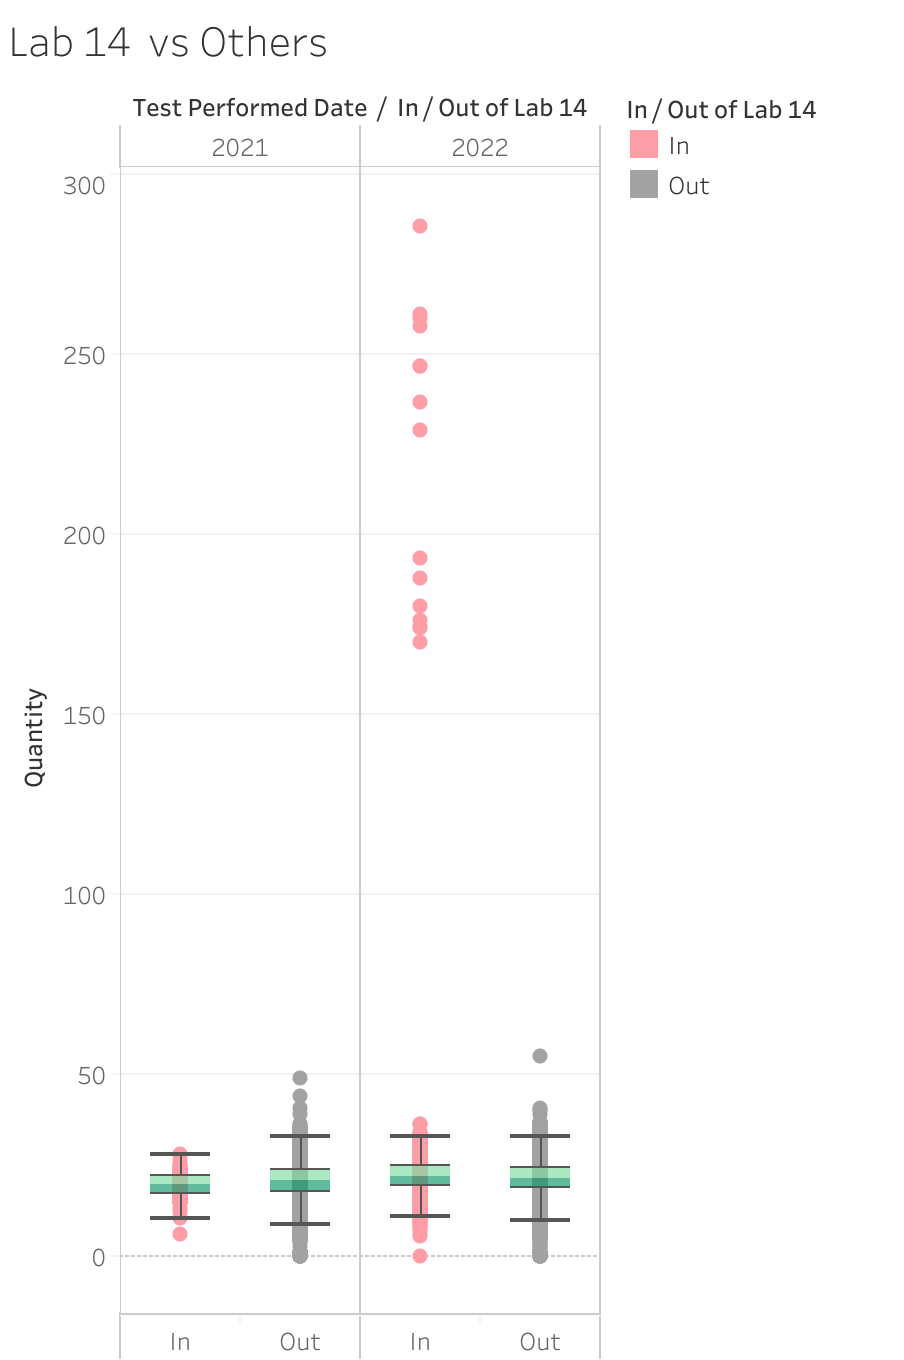
Note that the graph is made taller by the pink dots in 2022: which are issues that are happening in Lab 14! This shows a bunch of values that are above 100 — which definitely seems like something wrong. When I dig into the data, I find the following comments on high value rows.
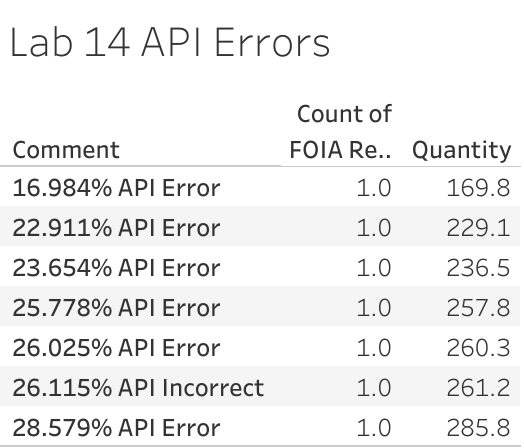
This definitely shows there was an issue! Once we eliminate those API-caused high values from the graph, here’s what it looks like (and it shows that overall Lab 14’s median values are inline with the other labs). (Note that Lab 14 wasn’t around in 2020, so I went ahead and eliminated that column.)
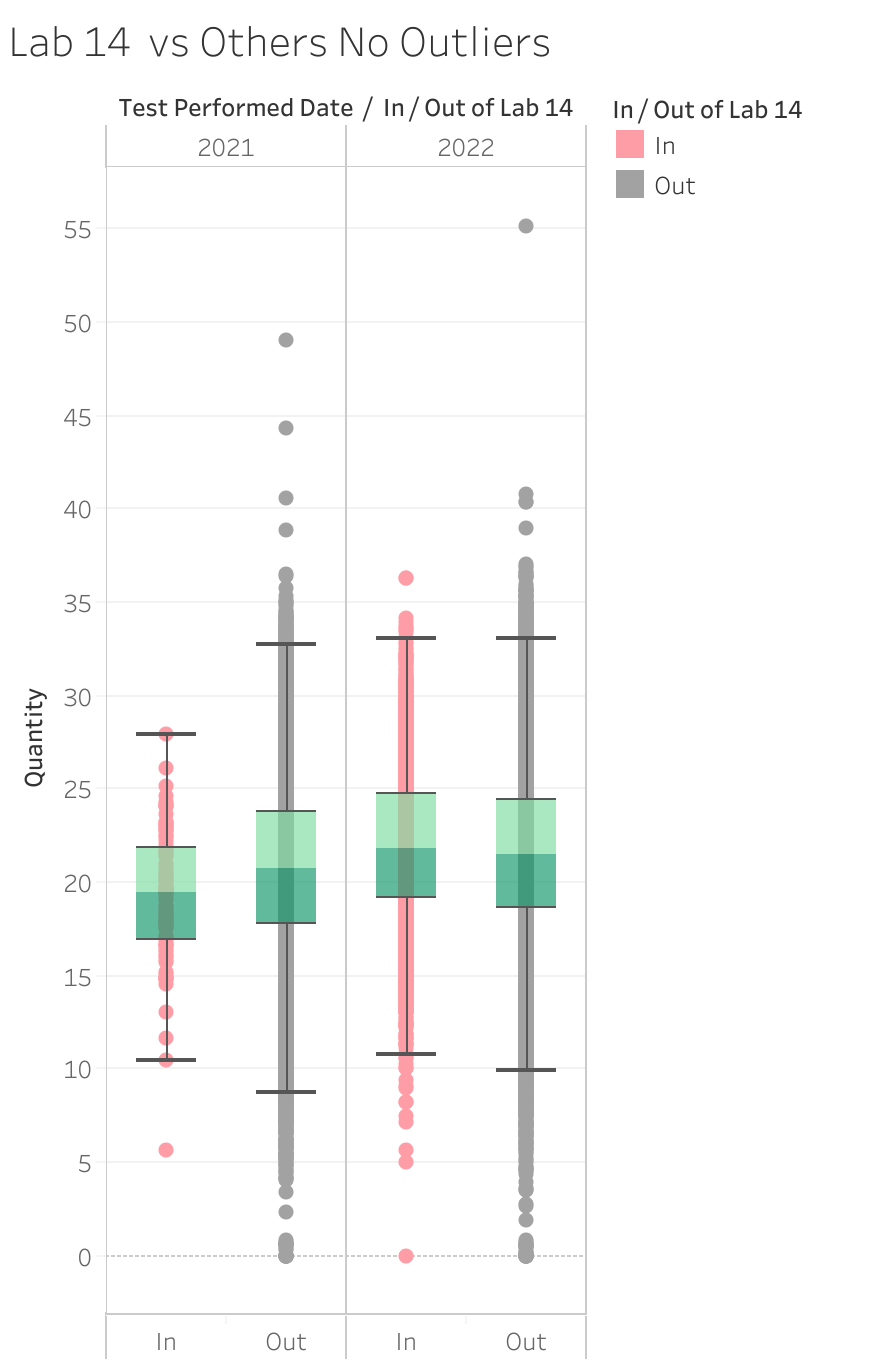
Now that we know Lab 14 had a bunch of API issues that shot values above 100 in some cases for Flower tests, Let’s revisit that graph that showed all of the high THC values, and eliminate those API issues and take another look.
Updated Results: High THC Strains by Lab
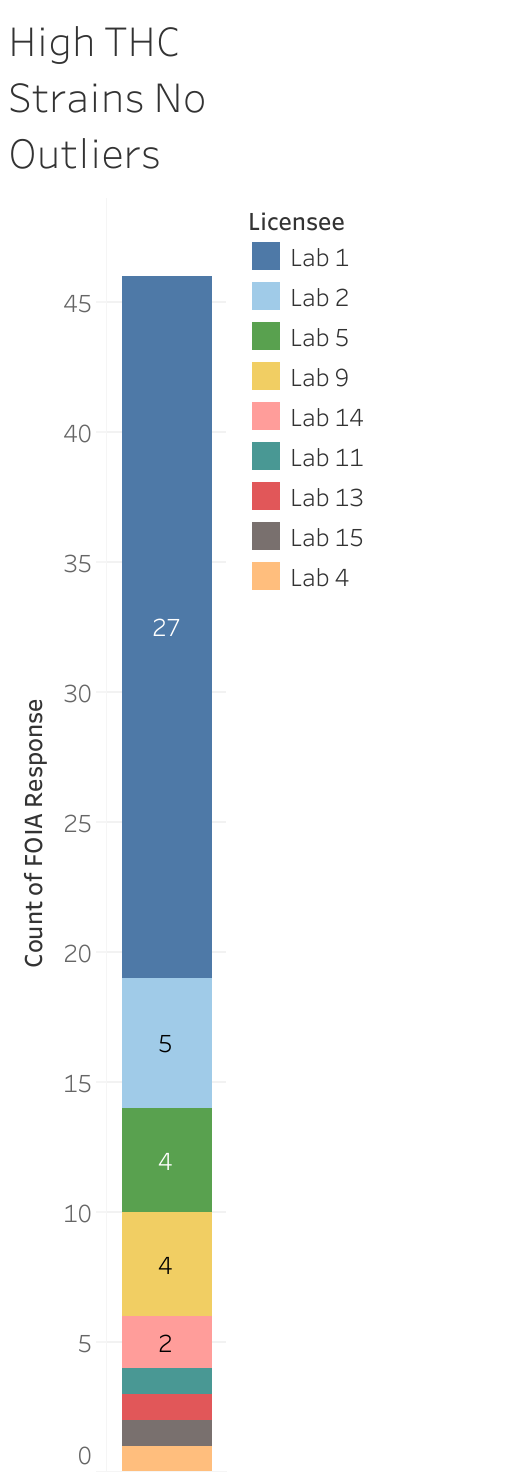
As you can see, over half of all of the high THC results are being produced by one lab.
If this is the valid Michigan data set representing all of the THC results for a year in Michigan, it’s obvious that a large amount of the high THC values are being produced by the lab identified in the data set as Lab 1.
Given that I was able to analyze this data relatively easily with free tools at my disposal, I can only assume that the state has similar monitoring programs in place. Wouldn’t it be great if they would regularly share their analysis, to demonstrate the health of their cannabis laboratory program?
Prospective Analysis, Oregon: 8 Labs, 4 Samples: The Round Robin
The ‘round robin test’ was my first effort at trying to understand what was going on. I wanted to send some samples to the labs to see what they reported. Tests like this are performed and are called proficiency tests, but several labs confided issues they had with how some of the current proficiency tests are run (such as not using cannabis, but a THC-spiked hemp sample).
I used the public-facing information on OLCC’s website about contact information for all of the accredited labs. I then started calling and emailing the numbers associated with their registration. Initially, 20 labs agreed to test, and I was over the moon.
Then, of course — reality set in the form of huge budgetary constraints. I talked with my state representative, who agreed that due to what I was doing, crowdfunding, etc. was off the table and he said the only legal way to approach funding was to seek it from the industry itself, unless I could self-fund. I don’t make a lot of money, and the project was going to cost thousands in various expenses — self-funding was out.
That’s when a lab stepped in to help, and another offered as well. Most labs agreed to waive their testing costs, but it would cost the experiment its ‘blind’ nature (when dropping off the samples, the labs now knew it was related to my project).
Once all of that happened, and I re-contacted labs to gauge their interest, given how everything had changed. A lot of them dropped out or ghosted me. There were even some that received a sample and didn’t participate. Crazy, huh?
In the end, I have results from 8 performed on the same 4 samples of material. And I’d say that the data is pretty interesting.
8 Labs, 4 Samples
Sample A, B, and C were all flower. Sample A is some of the craziest flower I’ve ever EVER experienced, and I’ve actually written about it before. I even had a lab ask if it was a kiefed batch: that’s how nuts flower A is.
Sample D was a distillate.
For all of these samples, I had them homogenized at ChemHistory. Originally I was going to try and build my own homogenizer using some instructions from one of the labs that said they were going to participate — but once they dropped out, I felt free to just ask for some help on this one!
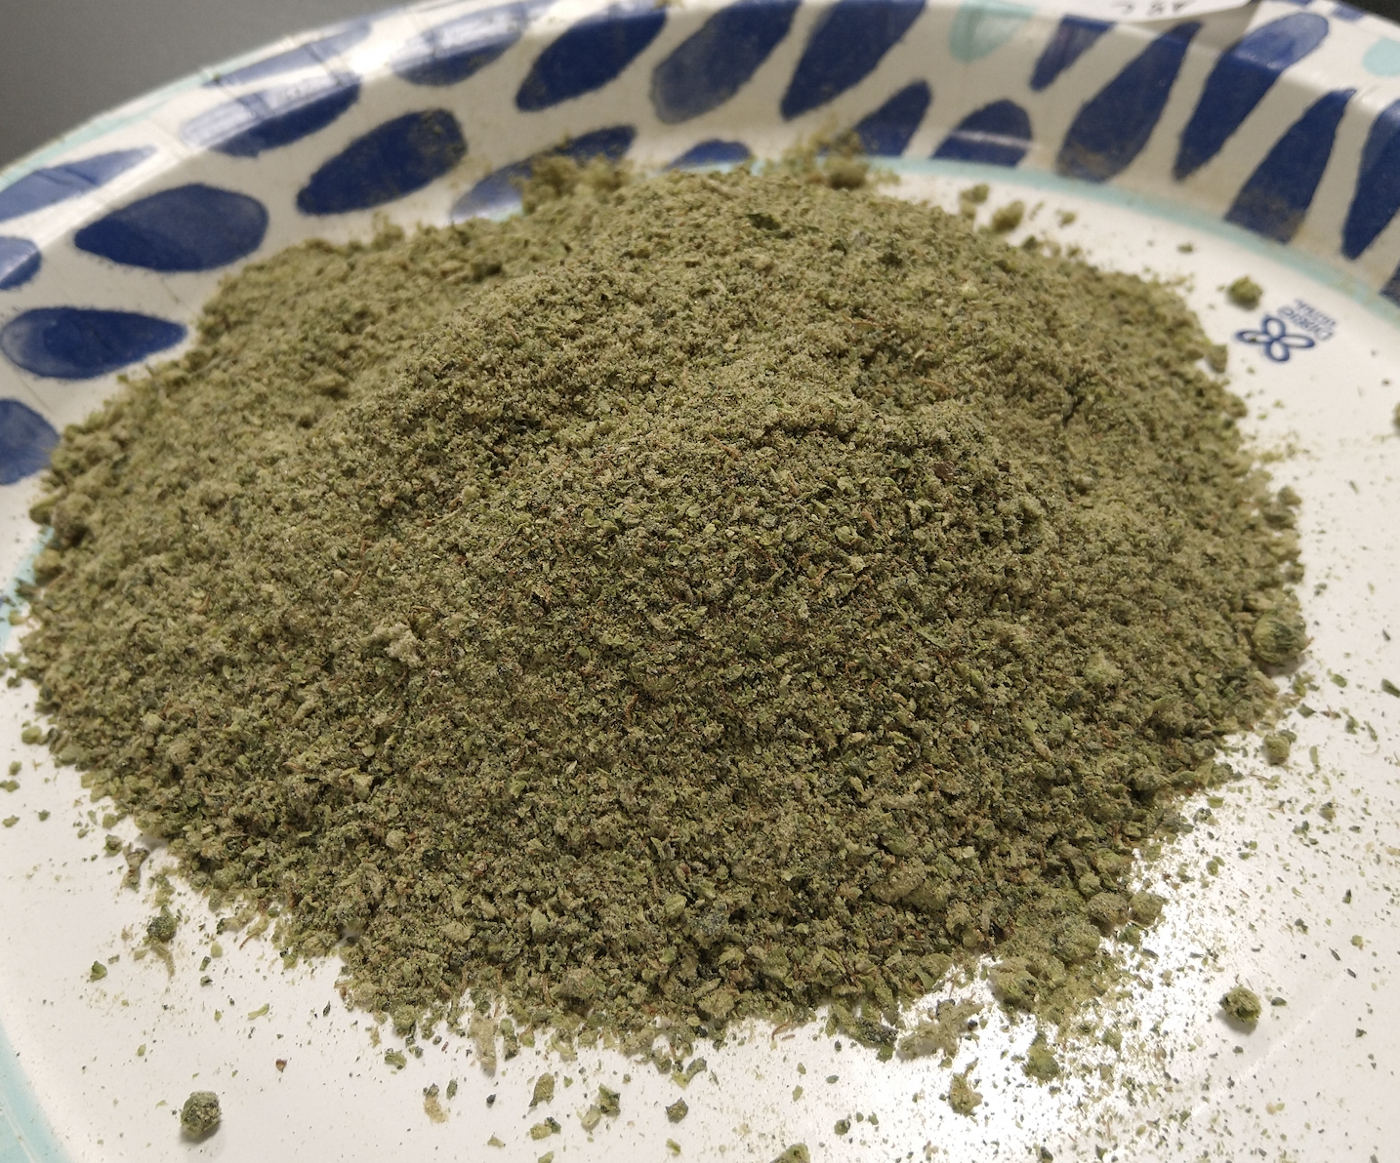
Homogenization is a very important process for cannabis testing. It’s how a lab ensures that any sample is representative. This is pretty complicated for a plant like cannabis, since potency can be higher in one portion of the plant vs. another. Essentially, everything is ground into tiny bits, and those particles mixed up so much that it can be trusted to be representative of the entirety.
One of our homogenized samples looked like this:
Results
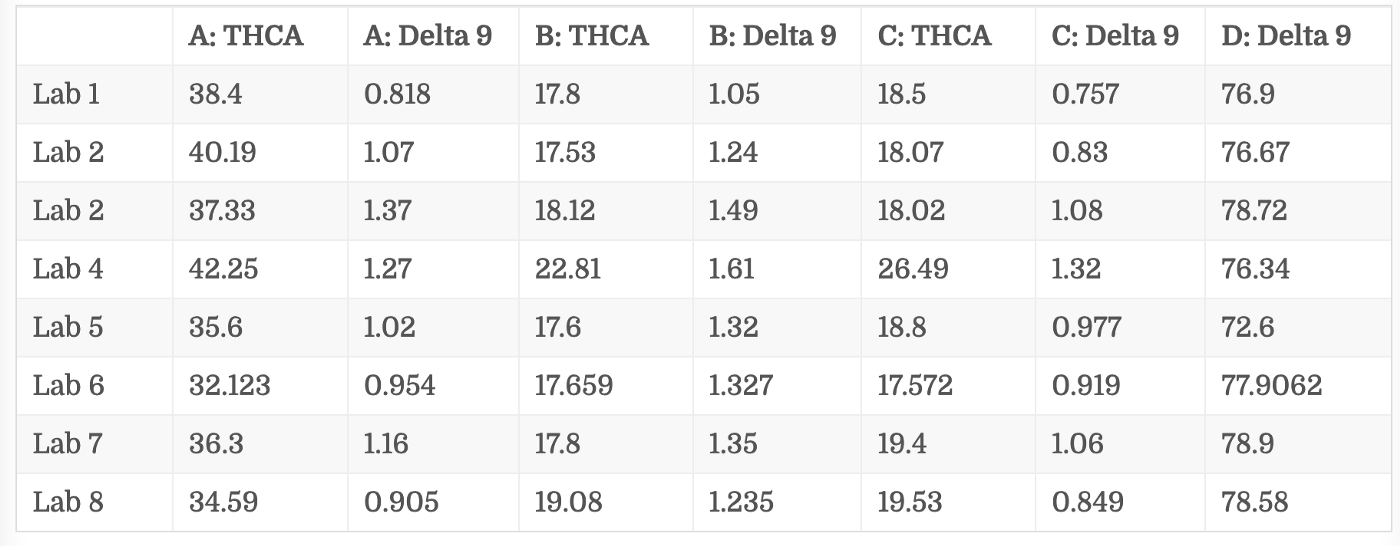
Why didn’t I include THC? Because Total THC is a calculated value, and can be derived from Delta-9 + (THCA*.877).
Summary Information:
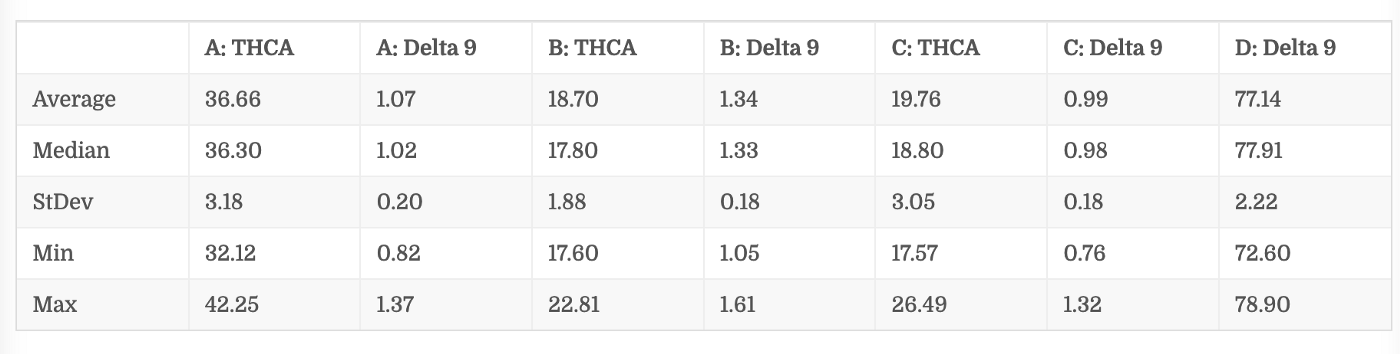
You’ll notice that in the original article where I reported this, I don’t make any conclusions or real observations about the data I’m reporting. But I’m going to say something now. For something that is such a ‘science’ there’s a lot of variability in these results. Particularly troubling is Sample C. While I’ve heard that the state has sent run tests similar to this, the fact is, this sort of one-off testing won’t be enough.
How My Experiment Was Flawed
Unfortunately, I wasn’t able to ‘blind’ the labs to the fact I was the one submitting cannabis for testing. First, I had to ask them for help to defray the costs. I heard that the state did similar proficiency tests recently, but the mere fact that I heard it is troublesome — the labs were easily able to identify that the samples were being run for OLCC.
Prospective Analysis, Testing Samples in CA
California’s cannabis market is one of the most storied. It’s no surprise that some of those tales include cannabis testing fraud. There have been many recent stories and even studies done around California’s testing issues. I thought a small scale off-the-shelf potency test would be compelling, and help to demonstrate what the issues realistically look like. I know that some are hesitant to believe direct retests by laboratories, and I hoped that a third party could help lend an eye to the situation.
When I first pondered potency inflation, I felt the most obvious approach to detecting it would be to take a sample off the shelf to some labs and see what I found out. I wrote about doing that very thing in Oregon.
It seems straightforward, right?
Not exactly, but we’ll save the nuances for another post. This time, let’s focus on the exciting part — the results!
Results of the Three Sample Test In California
Experiment Design
The three samples were all pre-packaged, non-infused, pre-rolls in shrink wrap and light-resistant packaging bought from legal dispensaries in the Los Angeles area. Infused pre-rolls provide more eye-popping potency numbers, but the way they do that is by including potency-enhancing products. Non-infused pre-rolls mean the products were just made of cannabis flower, which reduces the risk of homogeneity issues when re-sampling in the lab. Each lab received roughly 10 grams of each sample to run a full compliance test.
The samples were also all products that either linked to their original COA or listed the lab that conducted the original tests who was willing to confirm the accuracy of the tests for the THC potency results. It was important to have the original results to compare to. This requirement proved to really limit the selection, as California doesn’t require any COA information to be shared on retail packaging. There’s a genuine question of selection bias — wouldn’t the brands who list the testing information willingly also be the ones less likely to cheat? Perhaps that makes these results all the more shocking.
In 2 out of the 3 cases, we were able to obtain products that had full CoA’s. This greatly limits understanding of the cannabinoid percentages. The issue is that this presents a reduction in granularity in our overall dataset, but is representative of the consumer experience, as it was difficult to get even this much information.
Total THC as it appears on labels is a calculated value. △9-THC (delta-9 THC) is the psychoactive form of THC, and it’s available in the plant in small amounts. What is available in larger amounts is THCa, which is ‘tetrahydrocannabinolic acid.’ This acid is converted into △9-THC through heating, but with a loss of 12.3% in this conversion. Thus, the formula to represent the entire theoretical amount of △9-THC in a cannabis product is (delta-9- THC%) + (THCA% x 0.877).
THC Design ‘Crescendo’ Sativa Pre-Rolls
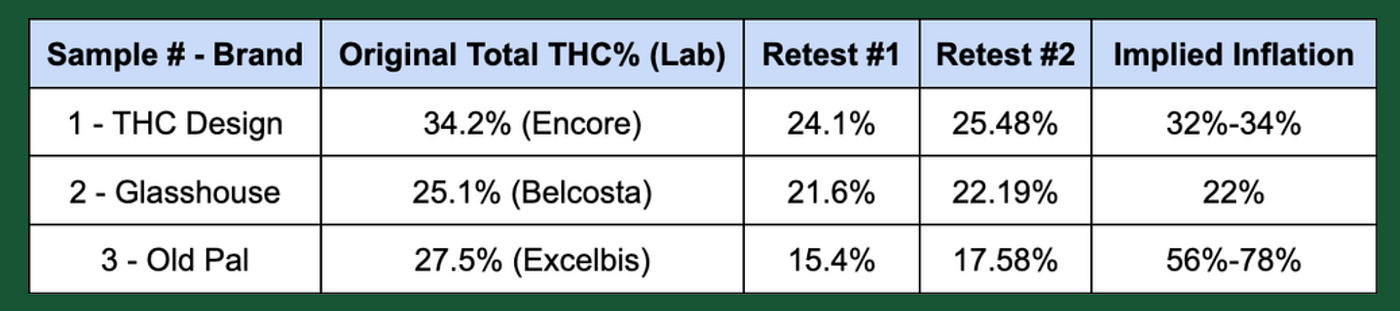
These prerolls were the most limited in available information. The THC Design Crescendo pre-rolls were tested by Encore. While there’s no COA, the accuracy is confirmed by Encore over email. Total THC is listed as 34.18%, and they were packaged on 2/14/2023. These measurements were taken using dry weight. Our first lab retested these at 24.06% THC, and the other retested at 25.48% THC (34% and 32% overstatement, respectively). These retests fall far outside of California’s 10% threshold. Even more troubling is the fact that at one of the labs, the pre-rolls also failed an Aspergillus test.
Glasshouse Garlic Starship Pre-Rolls
These pre-rolls were originally tested by BelCosta (COA). Their labeled total THC is listed as 25.1%, and they were packaged on 7/14/22. These measurements were taken using dry weight. One lab retested the sample as having 21.55% THC, and the other retested them at 22.19% THC, representing a difference of 16% or 13% — which is outside of California’s 10% threshold.
Old Pal Tiki Punch Pre-Rolls
Originally tested by Excelbis (COA). Their total THC is listed as 27.5327%, and they were packaged on 7/26/2022. These measurements were taken using dry weight. One lab retested the sample as having 15.4% THC, and the other test indicated 17.58% THC. The difference between the label demonstrated 78% or 56%, respectively. Both of these are very, very much outside of California’s 10% threshold.
Built on the Shoulders of Giants: The Study Done by 2 Labs in CA
This three sample run hasn’t been the only sort of work of this type conducted in California. One of the labs that tested for us, Anresco, was involved in a study that included 150 samples in California.
For this study, several labs across California were frustrated with the current climate of lab testing and decided to participate in this study. Their results demonstrated that 87% of cannabis products they tested overstated THC on the label by more than 10%, and around half of them overstated THC on the label by more than 20%.
Why Off-the-Shelf Testing is Effective
I’ve explored the importance of off-the-shelf testing as one of many vital components to a healthy cannabis regulatory environment. Testing THC potency off-the-shelf and publishing the results helps to demonstrate the importance of off-the-shelf testing for regulators. It’s vital that these tests be run by an organization without economic incentives.
Why These Studies Are Limited
We’ve already demonstrated the weaknesses of proficiency testing that isn’t run blind, and these sorts of tests can only yield so much information on this scale. While information from laboratories checking products in their markets is interesting and allows them to use their resources to support these efforts, there can be economic motivation behind them doing so.
The states need to be the ones fulfilling this role to keep the market in check. There are a variety of ways that states can support similar audit efforts, whether the regulators see fit to (1) work with legislators to establish reference labs, (2) leverage labs at their Department of Agriculture, or (3) run multi-sample proficiency tests using off-the-shelf cannabis. But it’s also important that there are disciplinary actions built into regulations that allow for penalizing those who engage in THC potency inflation, and give mechanisms to remove overstated products from shelves.
Otherwise all of this testing would be for nothing.
What Does This Mean for Consumers?
These results confirm that California consumers are probably overpaying for cannabis products due to incorrect information on the label. None of the products tested met the state’s standard for being within range of THC potency on the label.
I’ve heard a lot of people say ‘who cares if stoners don’t get as high,’ but that’s not what this is really about. It’s about consumers being misled by producers, labs, and retailers.
My personal interest in all of this started with a couple of things — as a cannabis patient I was trying to understand what it was about cannabis that helped address my migraines and my mental health struggles with a form of PTSD known as ‘complex PTSD.’ I started journaling about cannabis trying to figure out what terpenes and cannabinoids gave me relief, and I found quickly that the information on the label was often not enough to give a complete picture. I then started to discover that in some instances, the information was even unreliable. There are many other medical patients out there like me, whose pain was used to create the cannabis industry, who are now being misled about the medicine they helped to make legal.
I also don’t want to under-state the result that one of the pre-rolls failed for Aspergillus Flavus in the retest. It’s yet another demonstration of just how important it is for state regulators to tighten cannabis lab regulations and audit procedures.
How Does THC Potency Inflation Happen?
1. Sampling Cheats (Laboratory / Producer)
Appropriate sampling procedures are designed to ensure that the sample taken from a cannabis batch is representative of that batch. The reason that I’m listing this first and foremost is — if the sampling is done incorrectly, the results will suffer at best and be rendered meaningless at worst.
First and foremost, batch sampling can weaken the chain of custody for cannabis samplers. In most cases, the farms or producers are in control of the sample that is presented for sampling, and they can present the incorrect material for testing. This means that there is no way to guarantee that the product which is being presented for sampling is the one similar to what ends up on the shelf.
In some states, sampling regulations leave a lot to be desired. In Oregon, batches are allowed to be kiefed. ‘Kief’ refers to the trichomes that fall off of cannabis when it is disturbed — this fine powder contains a high percentage of THC. ‘Kiefing the batch’ refers to the process of adding kief back into the batch of flower before testing.
But farmers and producers aren’t the only ones that can manipulate samples — labs can too.
There are different ways lab-side sampling issues happen. A sampler could be handed a bribe and a pre-prepared sample. Farmers could leave the samplers with some kief and some time. There have been accusations that farms can request a particular sampler known to sample in a way that is good for the farm.
- These are all methods that have happened in reality — among several other ways. But the bottom line is: If a sample isn’t representative of the product, the test results are meaningless, no matter how we got there.
2. “Mathemagic” (Laboratory)
Using Moisture % as a way to alter the number. Moisture content or moisture percentage calculations present an opportunity for THC percentage numbers to be ‘tuned.’ The impact of this little mathemagical trick is slight, but it could be enough to make flower just a bit more viable in the current (cutthroat) marketplace.
Using a different calculation for loss on drying. There are two possible ways to calculate loss on drying:
(moisture loss) / (wet or starting weight)
(moisture loss) / (dry or ending weight)
These formulas render slightly different results, and present another way that labs could make a subtle change in the THC percentage numbers. Labs aren’t always clear or consistent on which methods they use, and different methods mean you aren’t always comparing apples to apples.
3. Spike The Sample (Laboratory / Producer)
There are a lot of ways to spike a sample of cannabis. This behavior ranges from kiefing the batch (which is legal in some places, like Oregon) to spiking the sample with distillate.
Luckily for regulators, each version of spiking a sample is detectable.
Using distillate used to be a popular way of increasing the potency of flower until it became easy to detect by looking at the ratio of delta-9 THC to THCA. The use of THCA isolates is similarly detectable.
Spiking samples to get higher potency values is a common and fast way to increase potency for selected results, especially if the state lacks effective lab audits that include off-the-shelf testing.
4. Using a Reference Standard Known to Give High Results (Laboratory)
A cannabis testing reference standard is used to calibrate testing equipment. Many of the best versions of reference standard material require DEA licensure. This isn’t an option for many cannabis testing laboratories, as many are federally illegal businesses. The attainable standards present imperfections that can impact the results, and in some cases this is exploited by the laboratories.
This is a particularly powerful way that cannabis labs can manipulate THC percentages, as it could impact every result (instead of just individual samples).
5. Calibration ‘Tricks’ (Laboratory)
Calibrating the lab equipment to accurately reflect results is an important step in creating accurate lab results. An intentional miscalibration of the machine would skew all of the results — and some states have regulations that standardize parts of the calibration.
Most calibration ‘tricks’ could be caught during a thorough audit by regulators. There is no way to address all of the possible tricks that could be used without a comprehensive audit of the entire process, including preparation of the reference standard for calibration. States require PT tests to confirm calibration of results, but oftentimes labs know when they are being tested or are required to ‘self-audit’ their results and don’t have the results double-checked. This leaves a lot of room for potential cheating.
This is another method that could elevate the results en masse.
6. Incorrectly Entering Sample Weight for Calculations (Laboratory)
A simple way to skew THC percentage is to simply enter an overall lower mass for the sample. While the equipment used to record the mass must be calibrated daily, there is nothing to prevent this, and very few labs have the equipment that interfaces this information with their lab information system, much less regulatory systems. Recording a mass around 10% lower than actual will yield roughly 10% inflation for potency.
Say you have a 1.1 gram sample that has 1000 mg of THCA in it. 1000 mg THCA / 11000 mg sample weight = .09091 or 9.01%. If I change the sample weight to 1 gram instead, 1000 mg THCA / 10000 mg sample weight = .1 or 10%.
7. Dry Labbing (Laboratory)
In this instance, the lab doesn’t even bother to run the tests, and instead puts in the numbers that will satisfy their clients’ needs.
8. Lab Shopping (Farmer / Producer)
Many in the industry will tell tales of farmers and producers shopping product from lab to lab, seeking the sorts of THC percentages that will make their flower or product more marketable.
9. Intentionally Overstating THC Percentage Than What is Labeled For Advertising (Retailer)
In many states there are generous allowances in how accurately a retailer must state THC percentage. For example, California allows product labels to be within a 10% margin of error and Colorado allows up to 15%. Retailers have been accused of overstating the percentage as high as allowable by law in order to get customers in the door.
10. Last, But Not Least: The State Doesn’t Stop Them (All Of Them — Farmer / Producer / Laboratory / Retailer)
When regulators are incapable or unwilling to address behavior by bad actors, the impact to the market is severe. The THC percentages can spiral out of control. Unchecked manipulation of the THC percentage rendering the number meaningless and decreasing consumer confidence in the product and testing process.
The nascent cannabis industry has demonstrated its importance to consumers and its relevance as a market. One of the arguments used to legalize cannabis was to make cannabis safe for people to consume through full testing. Unfortunately, that is a promise that the industry and its regulators have still failed to completely deliver on. It is vital that regulators set up a system of checks and balances that includes off the shelf testing and a reference laboratory to ensure that the product is safe and labels are accurate.
They Don’t Just Lie About Potency
What I’ve been saying for the last several months is just how if a lab will lie about potency, they’ll lie about pesticides. And it ends up, I’m right.
In other words, the anti-science behavior of these labs could start costing people their health and lives.
In a stipulated settlement recently released, a lab that railed to me about other cheaters, joined the coalition! And here is the stipulated settlement against them.

The synopsis states: “SYNOPSIS: — A laboratory licensee reported marijuana test samples as “passed” during a period when their equipment was not detecting certain pesticide analytes. Because ORLAP is the agency primarily responsible for overseeing laboratory certification and they elected to recertify this lab even after this issue came to light, OLCC Executive team approved this settlement reduction to a civil penalty or suspension in an effort to act in coordination with our ORLAP partners.”
This made me laugh, but not in a ha-ha funny kind of way but that horrible empty laugh of someone who is watching something they love be destroyed. Not only does OLCC throw ORELAP under the bus for the lighter penalty, but also spells the agency’s name wrong (at least according to ORELAP’s website). With precision like that, is it a surprise I don’t totally trust them?
But it’s digging for more detail that breaks my heart even more. The settlement states:
“OAR 845–025–8540(2)(a)(B), (2)(d) — From about
October 31, 2020 to about February 11, 2021, Licensee
and/or Licensee’s employees, agents, or representatives
misrepresented the testing results of marijuana items to
consumers, licensees, and/or the public when they
discovered in September or October 2020 that quality
control measures indicated that their equipment was
unable to test for several types of pesticides, but
Licensee and/or Licensee’s employees, agents, or
representatives nevertheless issued Certificates of
Analysis stating that the samples did not contain
actionable levels of any of the pesticides being tested for
and therefore that the samples passed pesticide testing,
when in fact several of the pesticides would not have
been able to have been detected due to the equipment
failure.”
In other words, the lab knew from October 2020 until February 2021 that their equipment was INCAPABLE of testing for pesticides, and just passed those tests anyway. And, the state of Oregon did nothing about that until 2022, when they decided that a 32 day suspension would be an appropriate recourse for intentionally endangering consumers.
Can’t Accreditation Stop This?
At the bottom of nearly every cannabis laboratory website is a cluster of badges indicating the accreditations and affiliations of the laboratory. While laboratories tout participation in these programs, it is rare that the purpose of them is clear to consumers. Accreditation programs like ISO-17025 or TNI are designed to demonstrate a laboratory’s competence in producing tests results that are reliable and accurate, but they were never designed to demonstrate a laboratory’s ethical integrity. Even in the best of cases, accreditation is not a substitute for strong, sensible regulation and auditing by the state.
Cannabis legalization promised consumers that cannabis would become safe in addition to being accessible. The need for testing that would demonstrate that cannabis was free of contaminants created the rapidly developing and highly competitive cannabis testing market. Ultimately, the objective of cannabis lab testing should be to ensure that the products are free from harmful contaminants and that the potency and composition of the products meet labeling requirements for the state.
About Accreditation
Accreditation is the formal recognition of a laboratory’s technical competence and ability to carry out specific tests. Accreditation by a recognized accrediting body helps to demonstrate that a laboratory is capable of reliably creating accurate test results, and has standard operating procedures and quality management programs in place. Accrediting bodies are third party organizations which assess the laboratory’s quality management system, technical procedures, staff competency, and equipment calibration to ensure that the laboratory is able to produce reliable and accurate results.
In other industries, the federal government asserts authority over manufacturing processes and consumer safety testing. For example, the Food and Drug Administration (FDA) supplies Current Good Manufacturing Processes (CGMP’s). Much like accreditation programs, CGMP’s seek to assure the quality of products by requiring manufacturers to control many facets of their operations. The CGMP’s include rules around quality management systems, raw material acquisition, and operating procedures for the producers in addition to rules regarding testing laboratories. CGMP’s are a minimum set of standards that intend to give manufacturers some flexibility in determining how their processes and operations can meet those requirements.
As cannabis is still federally illegal, the industry operates without federal infrastructure such as the FDA. This means that rules and regulations are created by the state. States often depend on the third-party accreditation process. This means that in cannabis, accreditation increases in importance.
What Does Accreditation Examine?
Generally, accreditation seeks to examine many facets of a laboratory’s operation in order to understand how rigorous their approach to testing is. Common areas that accreditation analyzes are:
- Qualifications of Personnel, especially in key roles
- Standard Operating Procedures (manual for all tests)
- Analytical Processes
- Proficiency Testing
- Quality Control
- Laboratory Security
- Chain of Custody
- Specimen Retention
- Records Keeping
- Quality Management Program
- Results Reporting Mechanism.
ISO-17025
One of the most common accreditations that cannabis labs cite is ISO-17025. ISO-17025 is an internationally recognized standard for laboratory best practices that “enables laboratories to demonstrate that they operate competently and generate valid results, thereby promoting confidence in their work both nationally and around the world.” ISO, the International Organization For Standardization, is a non-government organization made up of 167 national standards bodies. The 17025 standard has had three versions, with the latest being published in 2017.
The ISO-17025 accreditation requirements include (1) information on establishing appropriate quality management systems, (2) laboratory personnel duties and requirements, (3) the creation of a quality manual and complete manual of all processes and procedures, and (4) demonstration of a training plan for all employees and records of its implementation, in addition to more technical detail. The standard also specifies that internal audit and other quality programs must be established.
All of these requirements are evaluated during an on-site assessment by a third party before ISO-17025 accreditation is granted to a laboratory.
However, while adherence to standards of laboratory best practices like ISO-17025 can help to demonstrate a laboratory’s commitment to best practices, standards are ineffective at policing behavior by bad-actor cannabis labs or producers.
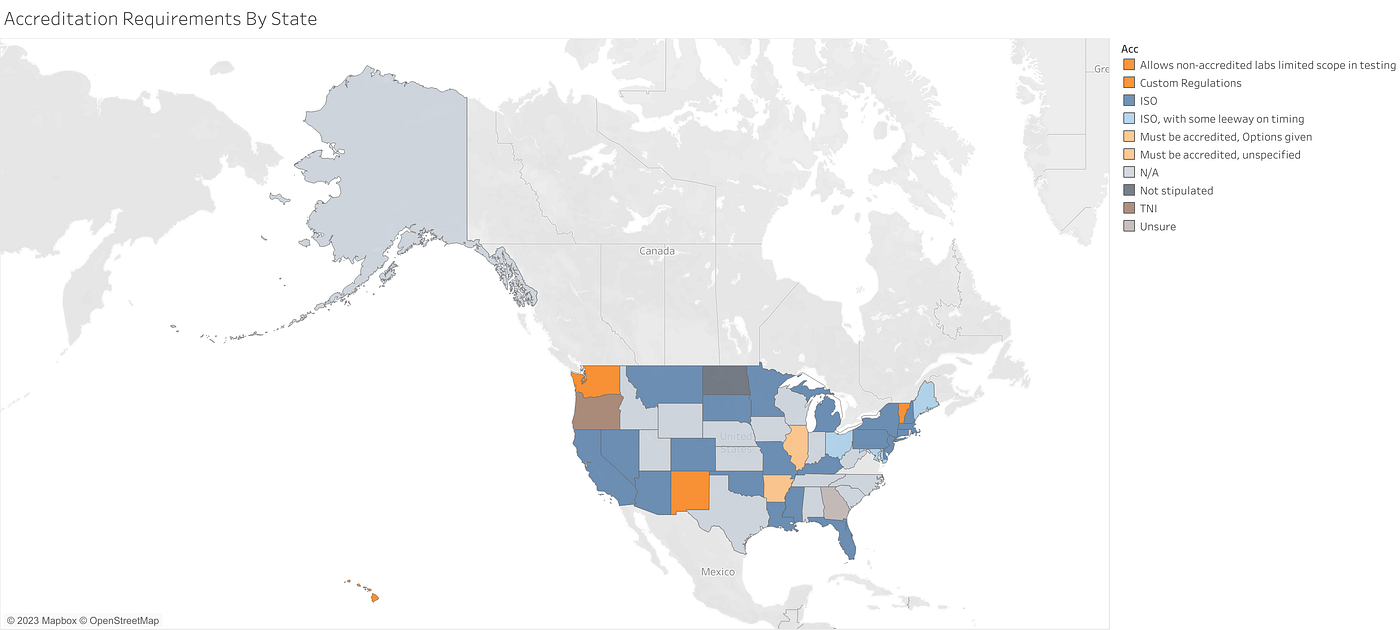
Chart Data: Arizona Arkansas California Colorado Connecticut District of Columbia Florida Hawaii Illinois Kentucky Louisiana Maine Maryland Massachusetts Michigan Minnesota Mississippi Missouri Montana Nevada New Hampshire New Jersey New Mexico New York North Dakota Ohio Oklahoma Oregon Pennsylvania South Dakota Washington
Standards Don’t Test for Lies
Labs that are willing to inflate THC or pass products that have failed pesticide or other tests can and will continue that behavior — even at ISO-17025 accredited laboratories. For example, Washington had to shut down a lab, Praxis, that falsified over 1,200 COA’s to inflate THC results despite having their ISO-17025 certification. It’s true that ISO-17025 requires exacting processes, training programs, and quality systems, but dishonest people can always find a way around a rule if the money is good enough.
The ISO standard includes on-site assessments, but the ISO-17025 on-site assessments are in no way blind. That means, there is no way for these auditors to guarantee that the testing procedures and processes that they evaluate are consistently run that way. We’ve discussed how important blind proficiency testing is to the cannabis industry because of its many nuances, as well as the ‘observer effect’ (the disturbance of a system or process by the act of observing it). Since the on-site assessments are scheduled they are ineffective for trying to catch bad actor labs.
That was never the intention of the ISO-17025 accreditation! Or any accreditation. Accreditations weren’t created to stop bad actors — they’ve been created to demonstrate technical capability.
Laboratory best practice standards such as ISO-17025 were intended to help laboratories who wanted to stand out from the crowd — those who were willing to invest in making their scientific processes conform to a higher standard. They were never meant to ‘catch’ someone in bad behaviors: that’s the job of regulators. Many states have opted to require that laboratories are ISO-17025 accredited, but it’s vital that state regulations enhance and elevate those standards and have mechanisms in place to enforce them.
All of this has been about how things compare to what is labeled, but there’s bad news about that, too.
A Lot of Times, What You Need to Know Isn’t On The Label
One of the surprising things for me to discover was just how inconsistent states were in their labeling laws — and how opaque cannabis testing is for consumers seeking to understand what’s in their cannabis (and what’s not).
Regardless of the product being sold, labeling is a primary form of communication to consumers about what they are buying. It’s key to marketing, legal compliance, and consumer safety. It’s a way to inform the consumer about what’s in the product, its effects, and information regarding risks.
The importance of labeling for cannabis products can’t be understated. As states and regulations take time to stabilize, the onus is on the consumer to understand what businesses are trustworthy and which aren’t — especially in light of just how whacky the lab data can be.
In a perfect cannabis testing world, cannabis testing would be centered around consumer safety.
Dream with me for a minute.
I imagine a market in which labs have regular, blind proficiency tests run by the state — preferably a state-run reference laboratory to support off the shelf testing, labeling would de-prioritize exact THC percentages, and full Certificate of Analysis (CoA’s) would be available on demand (either at the dispensary at time of purchase or via online lookup / QR Codes).
Readers, we are far from that dream. Right now, there aren’t a lot of states that even require the laboratory to be listed on a label, much less require that the entire CoA be available for consumers.
Here is the very disappointing state of play:
There are only 8 states that require the laboratory to be listed outright on the label (though I’m unclear on the rules for testing of Low THC oil in Louisiana and Georgia). In Vermont (VT), a QR code is required, but a recent test of a QR code from VT on a recalled product came up as a dead link. In South Dakota, while the lab name isn’t required, there is only one cannabis testing lab in the state.
Each state’s results are shown below in map view and listed in the below table (please click here for the full Tableau):

State Lab Listed on Label? Alaska Yes Arizona No Arkansas Yes California No Colorado No Connecticut No Delaware No District of Columbia No Florida No Georgia Unsure Hawaii No Illinois Yes Kentucky Yes Louisiana Unclear Maine No Maryland No Massachusetts No Michigan Yes Minnesota No Mississippi No Missouri No Montana Yes Nevada No New Hampshire No New Jersey No New Mexico No New York No North Dakota No Ohio Yes Oklahoma No Oregon Yes Pennsylvania No Rhode Island No South Dakota No, but there’s only one lab Vermont No, but requires website / QR Code Washington No West Virginia No
Caveat Emptor
Unfortunately, there are a lot of challenges facing cannabis laboratories as they all gun for that cash grab. Since the economic incentives for laboratories are to give results that increase marketability of cannabis, they have many ways of doing just that. This leaves consumers in a difficult place when it comes to understanding what’s in their cannabis, as even with the sparse information available on some labels it’s hard to know if the information is trustworthy. Many states still haven’t availed themselves of tools at their disposal that could calibrate the playing field and protect consumers — simply because the lack of economic upside is not in line with their corporate interests. That must change.
Something’s Gotta Give
There are going to be lawsuits. There are going to be more honest labs that are run out of business. Dishonest labs will continue to use every method in the book to cheat the numbers as much as they like — including hijacking efforts to stop them.
This will escalate, because cannabis is a huge, burgeoning industry, and testing is an economic gatekeeper to riches. With each inflated or improper result, consumer confidence in science will wane. The longer regulators wait to take any sort of appropriate action, the worse the situation will become.
Sources and Further Reading
The frequency distribution of reported THC concentrations of legal cannabis flower products…
Leading Cannabis Platform Providers Form Open Standards Technology Alliance in State of Washington
The frequency distribution of reported THC concentrations of legal cannabis flower products…
Variation in cannabis potency and prices in a newly legal market: evidence from 30 million cannabis…
Cannabis Lab Testing Continues to Evolve in Washington | Continuing Education
Manipulation of Procurement Contracts: Evidence from the Introduction of Discretionary Thresholds
40% THC Flower?! How Lab Shopping and THC Inflation Cheat Cannabis Consumers
Do You Know What’s in Your “Legal” CBD or THC Vape?
Can Washington fix its broken cannabis lab testing system?
Hemp’s stumbles reveal hurdles in Wyoming’s race to diversify — WyoFile
How Fraud is Proliferating in The Cannabis Testing Market
The Inflated THC Crisis Plaguing California Cannabis
California’s $11 million cannabis lab is off to a rocky start